This website is intended for healthcare professionals only.
Take a look at a selection of our recent media coverage:
23rd February 2023
Here we report on a retrospective study undertaken in a UK hospital that found that the overall anticholinergic drug burden did not change significantly during an inpatient stay on five wards typically caring for older people
Anticholinergic medications (ACM) are prescribed for the management of conditions such as depression, psychosis, Parkinson’s disease, overactive bladder, and chronic obstructive pulmonary disease. These are among the most prescribed medications in patients with polypharmacy. One systematic review looking at adverse effects found that certain individual ACM or increased overall exposure to ACM may increase the risks of cognitive impairment, falls and all-cause mortality in older adults,1 though others argue that the evidence for harmful outcomes in certain groups of older patients remains uncertain or deficient.2,3
What is the anticholinergic burden?
Anticholinergic burden (ACB) is defined as the “accumulation of higher levels of exposure due to one or more ACM and the attendant increased risk of medication-related adverse effects”.4 A number of anticholinergic quantification scales have been reported in the literature, providing a list of ACM and a rank of low- to high-risk based on anticholinergic activity. However, most scales are constructed using expert opinion panels, in vitro data and literature reviews. These scales each include different drugs and have variations in the rating of the included drugs, meaning variability and inconsistency among the scales exist.5,6 As an example, it is suggested that the relationship between ACB and fracture risk might differ depending on the ACB scale used.7
Inappropriate prescription of ACM to older patients in primary care has been reported extensively.8.9 In England, the NHS Business Services Authority anticholinergic burden prescribing comparator can be used to identify the number of patients at risk of anticholinergic side effects at Clinical Commissioning Group, Primary Care Network and GP Practice level, and to prioritise work in this area.10 However, ACM use in a hospital setting has been less extensively studied and with varying results. ACM prescription was found in 10% of hospitalised, older patients using a database from a French general hospital covering 14,090 hospital stays by patients aged 75 and over.11 A Danish study, utilising the Anticholinergic Risk Scale, examined the association between ACM at hospital admission and mortality in older patients and found that such use is associated with short- and long-term mortality in geriatric patients, even when adjusting for other important variables such as comorbidity and activities of daily living.12 In this Danish study, nearly two-thirds of a total of 74,589 patients received ACM. Few patients received medications with an ACB score of two or three while a score of one accounted for 88.1% of the overall anticholinergic intake.
Previously in our Trust, a RADAR (RCHT Analysis, Data and Reporting) report had been developed that pulls daily prescribing data for ACM from the hospital’s e-prescribing system (CareFlow Medicines Management) for patients on five selected wards. These wards covered elder care, trauma (mainly older patients), stroke, and neurology. For each patient, the report generates the total ACB score, together with the names of any drugs that fall into the categories of an ACB score of 1, 2, or 3. This report was developed using the Ageing Brain Care scoring system.13 Patient characteristics (age and gender) are also displayed. The intention was that this report would be used by clinical staff to identify those patients with a high ACB who might be suitable for a medication review. However, a previous unpublished internal study has found that this electronically available report was not used by clinicians, mainly because of a lack of compatibility with workflow.
Our overall aim was to identify if the ACB score altered between admission and the last day on the ward for patients on those specific wards that are the subject of this RADAR report. The objectives were to report on changes to ACB score over the hospital stay and to ascertain if, in general, any particular ACM was stopped to reduce the ACB score.
Method
This was a retrospective study utilising the electronically available RADAR ACB score report that was run for November 2021 for those patients admitted to the five target wards. Data were extracted such that the report displayed any ACM that contributed to the patient’s ACB score both at admission and the final day on the ward. This extraction did not include medication listed on any discharge prescription. Patients on the same medication, for example, morphine prescribed as a standard-release oral formulation and an injectable formulation ‘as required’ accrued a score of only one. Likewise, the presence of both cyclizine lactate and cyclizine hydrochloride on the same patient’s electronic prescribing chart accrued a score of only one. Data were entered into Excel for analysis. Data for two wards that were more typical of care of the elderly patients were also analysed separately.
Ethics
Health Research Authority criteria for research and service evaluation were considered. This was a retrospective assessment involving no changes to the service delivered to patients, and we used the NHS Health research authority tool (www.hra-decisiontools.org.uk/research/index.html) which helped confirm that no ethical approval was required for this project.
Results
Over an approximate three-week period in November 2021, there were 262 episodes of patients admitted to the five wards. Sixty-two of these episodes were on the two wards grouped together for further analysis as they were considered to be more representative of care of the elderly patients. Excluding those whose admission was apparently less than one day, this left a total of 212 patient episodes (mean age 70 years, range 21–99, 100 male), of which 59 (mean age 74 years, range 23–97 years, 27 male) were on the two subset wards. Overall, the duration of stay ranged from one day (29%) to 5 days and longer (27%).
Overall, there was an increase in the total ACB score between admission and final day on the ward for the 212 patient spells from 322 (mean 1.52 per spell) to 456 (mean 2.15 per spell), and also across the subgroup of 59 spells from 105 (mean 1.78 per spell) to 120 (mean 2.03 per spell). This overall increase in ACB score was also seen when considering only those patient spells that were for 5 days or longer. The number of patients with an ACB score of 2 or ≥3 was greater on the final day on the ward than at admission when considering all 212 spells (Table 1). For the subgroup of 59 patient spells, it was only the number of patients with an ACB score of ≥3 that increased during the acute stay.
However, 9% (20/212) and 15% (9/59) of patient spells did show a decrease in their ACB score (Table 2). Across all patient spells, the most frequent medicines that were ceased were fentanyl, morphine, furosemide and co-dydramol.
Discussion
We examined the ACB of medication for patients admitted to a select group of wards caring for, in the main, older people. This analysis has shown an overall increase in ACB score during the acute inpatient stay for 212 patient spells from a mean of 1.52 per spell to 2.15 per spell. There were some instances where a reduction did occur – 9% of 212 patient spells and 15% of the subgroup of 59 spells.
Several studies with varying results have tracked changes to ACB during the hospital stay of older people. A study, utilising the Anticholinergic Risk Scale (ARS),14 described the burden of prescribed ACM in all older adults admitted as an emergency to any specialty in a large hospital in the UK. These authors looked at how ARS scores changed from admission to discharge and evaluated associations between both admission ARS and change in ARS score and hospital outcomes, primarily inpatient and post-discharge mortality.15 They found that from 33,360 patients included, just under one-third were prescribed an anticholinergic on admission, with 3266 (9.8%), 2479 (7.4%) and 4438 (13.3%) patients scoring 1, 2 or >3 respectively on the ARS. In our much smaller study, we found 46/212 (22%), 34/212 (16%) and 51/212 (24%) patients scoring 1, 2 or >3 respectively on the scale we used. These UK authors15 did find a statistically significant reduction in mean ARS from admission to discharge in all specialties. Interestingly, the largest absolute and relative reductions in mean ARS scores were seen in patients discharged by Geriatric Medicine and Trauma and Orthopaedics, although they report that patients experiencing either an increase or a decrease in ARS score from admission to discharge were more likely to have a prolonged (>10 days) hospital stay. Our five wards would be similarly classified as Geriatrics and Trauma and Orthopaedics, although we found an overall increase in mean ACB score. However, we only had ten patients with a prolonged stay and two of these had a decrease in ACB score
A similar study in New Zealand measured the ACB using the total Anticholinergic Drug Scale (ADS) score for 224 patients on presentation to and at discharge from a geriatric unit.17 Despite medication changes occurring during the hospital stay, there was no significant change in ADS score between admission and discharge. Compared with admission, 35% patients had a reduced ACB; 28% patients had an increased ACB, whereas 37% had no change on discharge.
A study based in the UK and Europe,18 described changes in the ACB in 549 patients admitted to hospital with a diagnosis of delirium, chronic cognitive impairment, or falls. They utilised an adapted 2012 revision of the original ACB scale.13 Key findings were that 21.1% of patients had their ACB score reduced, 19.7% had their ACB increased, 22.8% of ACM-naïve patients were discharged on ACM, and there was no change in the ACB scores in 59.2% of patients. The European study also observed that the same medications, while stopped in some patients, were started in others, and that more than one in five patients who were not taking anticholinergics when admitted were prescribed them by discharge.18 Compared with this European-based study18 and the New Zealand study,17 we found 9% had a reduced ACB, 37% had an increased ACB, and 53% had no change by the final day on the ward.
A specialist multidisciplinary team based in a UK Emergency Department was able to perform targeted medication reviews and significantly reduced anticholinergic drug exposure in frail older patients as measured by the ACB scale.19 Interestingly, only 2.3% (n=3/129) of ACB-naive patients were started on an anticholinergic drug (that is, ACB score 0 pre- to 1 post-review) and there were no other examples of patients experiencing an increase in ACB score during admission.
The importance of this topic of ACB is highlighted in the national Getting It Right First Time report, which recommends that older patients should have an initial review of medicines management when they are admitted to hospital. This report notes that the admission might be triggered by adverse drug reactions and the risks and benefits of drugs need to be reviewed. This can be done using a structured approach such as the STOPP-START tool, or the anticholinergic burden score to assess the risk of drugs that contribute to falls and delirium.20
It is recognised that the provision of guidelines and education alone do not seem to be sufficient to ensure the best medicines review and optimisation in older people. Whereas evidence shows an improvement in the quality of prescribing and deprescribing via the use of multidisciplinary teams, geriatric case conferences, medication review by pharmacists and the use of information technology to support medication decisions.21 In the context of reviewing and possibly reducing ACB score, we have in place in our Trust an electronic tool that identifies possible opportunities for review. However, we know this RADAR report is not utilised.
A strength of our study was the use of an e-prescribing system, which facilitated the accurate extraction of prescribed medication. We recognise the limitations of this retrospective study of patients admitted to a single acute trust during a relatively short follow-up period. During the pandemic, these five wards may have held outlier patients not under the care of the elderly team and so any review of ACM may not have been a priority. It is important to note that what was prescribed on the e-prescribing system at admission may be different to medicines identified at the reconciliation (clerking in) process, that is, some ACM might have been ceased/withheld at admission to the ward and we did not record this. Also, we looked only at prescribed medication, and we recognise that, especially for ‘as required’ medication, these might not have actually been administered to patients. In particular, those patients on Trauma would have had analgesic requirements (weak or strong opioids) accruing an ACB score typically of one per different opioid prescribed and this continued throughout the hospital stay with little opportunity to reduce the score, although these opioids might not then have continued into discharge medication. Finally, we did not record patient comorbidities.
Conclusion
In this study, the overall ACB did not change significantly during an inpatient stay on five wards typically caring for older people. It might be appropriate to raise prescribers’ and pharmacy team awareness of these practices such that there is more of a focus on ACB and the potential for corresponding iatrogenic effects.
Learning points
References
First published in our sister publication Hospital Pharmacy Europe
22nd February 2023
FASD is a common disorder that often is unrecognised and might present with one of a number of comorbid presentations. Recognition and management are the key to changing the trajectory of people’s lives
Fetal alcohol spectrum disorders (FASD) represent a range of body and brain conditions that are caused by consuming alcohol during pregnancy. First labelled and recognised in the English scientific journals by Smith and Jones as fetal alcohol syndrome (FAS), it later became understood and established that this condition had existed for a long time but had simply not been properly identified or labelled.1
Initial reports focused on some specific groups and very much on the physical presentation more than the neurological. For example, Smith and Jones reported on a case series from a first Nations population based around Seattle, Washington, USA. Earlier reports, in other journals, included a large case series from France identifying children who had physical and cognitive difficulties.1
It was only later that the spectrum of presentation began to be better understood and the physical stigma took less prominence. it became understood that the cognitive features have the greatest impact on behaviour and cause the lifelong difficulties.2
Diagnostic criteria
Early work identified four components that were crucial to a diagnosis. These included facial features, growth retardation, cognitive deficits and alcohol exposure.
The facial features include short palpebral fissures, an elongated and thinner philtrum and a thin upper lip vermilion as core (Figure 1). Additionally, a small head size and flat midface were noted as discriminatory but the former being part of neurological domain and the latter not quantifiable at the time. Other features, such as micrognathia, upturned nasal flares and characteristic hand and ear presentations, were also noted but presented more inconsistently.
Whist the prevalence of FASD is relatively common, all these features seen together is rare. Most recent UK prevalence estimates suggest that FASD presents in 1.8–3.8% of the population3 but full FAS criteria might only be seen in around 2% of this group.4 Therefore, FAS represents not the most severe, but the most recognisable part of the spectrum.
It became evident that there were timing effects of alcohol exposure that led to the physical manifestations.5 Also, in the late 1970s and early 1980s, when much of this work was being undertaken, technology did not exist to allow accurate measurement of many of these features. More recent work and understanding has led, through computer technology and 3D camera analyses, to a better quantification of dysmorphology. Because these techniques use thousands of landmarks for accurate measurements, linked to mathematical computer algorithms and calculations, better recognition of the features is possible. Therefore, early established features such as a flat midface can now be measured and quantified whereas before it was only assessed subjectively.6
The recognition that there were a range of presentations related to different levels of alcohol exposure led to different criteria being established. In 1996, the Institute of Medicine developed a consensus statement to begin to consider this broader-spectrum presentation.7 The terms fetal alcohol syndrome with or without confirmed alcohol exposure, partial fetal alcohol syndrome, through to alcohol-related neurodevelopmental disorder or alcohol-related birth defect were created. These did not define severity, only how clear-cut or obvious the diagnostic presentation might be. The lack of consensus around thresholds for the cognitive domain has continued to cause differences and discussion within the FASD community, which is unresolved even now.
Different criteria such as the four-digit schedule from the University of Washington,8 the IOM criteria,9 DSM V,10 the Canadian FASD network,11 Australian guidance,12 and, most recently, the Scottish Intercollegiate Guidance Network (SIGN) review in 201913 have all established sets of criteria.
These differences have led some to question the diagnosis. However, it is important to note that there is broad agreement between all groups as to the core components of the presentation. It is the sensitivity and specificity of the cut-offs that continues to be debated. The threshold at which a disorder is labelled remains the core of ongoing debate. Since the Scottish government sponsored review and the SIGN 156 guidance document were created, the National Institute for Health and Care Excellence in England has adopted these recommendations as a whole and therefore going forward,14 SIGN guidance will be the approach taken. Therefore, diagnostic criteria in the UK are FASD with or without sentinel features.
If clinicians are focused primarily on the dysmorphic features, it is unlikely that most cases will be identified. The wider prevalence of those who have prenatal alcohol and significant cognitive demands, that is, FASD without dysmorphic symptoms, is relatively common.
Primary features and disabilities
The most recognisable features, as highlighted, are those that are physical. It is the invisible, however, that cause the greatest impact for the individual. It is the underlying damage to the neurological pathways that have the greatest impact on the individual’s ability to live a relatively normal life. Due to alcohol having numerous mechanistic and pathological effects, there is great variability between individuals, yet a characteristic profile can be seen.2
Neurologically, alcohol is known to cause damage to central brain structures which particularly have white matter involvement. For example, the corpus callosum, the white matter tract that connects the two hemispheres, is known to show deficits and impacts on left and right brain connectivity. Other central structures such as the hippocampus, amygdala, orbitofrontal cortex, cerebellum and interconnected structures are also known to be affected. This means that deficits in executive function, emotional regulation, social communication, memory and neural processing speed can be present.15
Furthermore, evidence would suggest that damage can be seen at a cellular level. One such example is that neural migration can be affected to the point that cells appear in the wrong position within the brain. This can lead to inefficient processing and greater effort to complete a task compared with non-affected individuals.15
Research evidence would suggest that due to the relative preservation of some areas of function, the impact of the prenatal alcohol and FASD can go unnoticed until challenges are presented. For example, there is a difference between emotional regulated situations and how the individual functions. This can be defined as hot and cold executive function problems. In essence, this means in a clinic setting where the individual has no emotional or external distractions, function can appear to be better than in scenarios where these wider effects are impinged upon, leading to a lower ability to complete tasks.16 It is important therefore that these are considered during clinical testing. Real-world function is as important as observation in order to understand the impact on the individual as well as their ongoing support needs.
Associated with these presentations are wider neurodevelopmental comorbidities. Because essentially this is a neurological condition affecting pathways that are affected in other diagnoses, such as autism and ADHD, these are conditions that are common comorbidities. The nature and degree of the neurological damage will define whether these conditions are also seen. In a general population study, the rates are variable. Yet, increasing evidence points towards those with the most severe presentations, also having the most affected neurological function and the greatest long-term issues.17 This also impacts on an understanding of the therapeutic interventions that can be directed to support these individuals
Importance of multidisciplinary assessment
Because the neurological deficits seen with FASD are extensive, they cover broad areas. These include cognition, sensory processing, neurological deficits, communication and language, education, and adaptive behaviour. These therefore can be evaluated most easily if the assessment is completed by a multidisciplinary team (MDT).13 When considering the need to take account of the physical as well as the psychological features, teams can comprise a physician familiar with FASD and other associated conditions alongside psychologists, speech and language therapists and occupational therapists.13 Unfortunately, these professionals are not always available in many clinical practices.
Different availabilities of service provision and differing pathways offer different challenges. While an MDT may be gold standard, in the NHS at least, gold standard is not always possible. In some cases, approaches might need to be taken whereby one individual can collate a multidisciplinary assessment undertaken by differing professionals.
There are various ways of doing this. Genetic testing, for example, is an important exclusion factor in diagnosing FASD. Genetic conditions make up the most common presentation for neurodevelopmental problems and must therefore be ruled out.18 A geneticist can also identify dysmorphology and other possible physical manifestations.
There are questionnaires to assess communication, executive function, memory, adaptive behaviour as well as sensory and motor functioning. These can be used by individual clinicians to give indications of levels of deficit, without the need for multi-professional involvement, in less complex cases at least.
Evidence would suggest that these tests do not consider the same things as direct assessment19 but can be used to adequately provide insights into underlying function to support diagnostic processes.
Therefore, while all the criteria suggest an MDT is preferable, it is feasible for a single individual to pull together information from multidisciplinary sources. This is akin to general physicians using haematology, radiology and other pathological samples to come to a diagnostic conclusion alongside their own history and examination. This would allow more straightforward cases to be held locally by single practitioner, leaving the more complex cases for the more expensive and less available MDT. Here, where direct observation by a trained specialist, alongside these psychological measures become vital, the MDT is most needed, but resource is then used efficiently.
Importance of early recognition
Numerous secondary disabilities have been linked to FASD. Due to FASD presenting with one of its many recognised comorbidities, it can often be a hidden presentation.20 When unrecognised, these secondary issues can have significant lifelong effects.
The classic study was completed in the early 2000s and carried out over 30 years.17 This identified that in people who were not identified early, then presented late to clinical services, poor secondary outcomes were common. These included 90% having mental health problems, over 50% experiencing some form of confinement during their life and over 50% having a disrupted school experience; 30% of the same group went on to have their own addictions.17
By identifying the individual early, a different trajectory can be created, thereby leading to better lives for these individuals. Interventions continue to develop. Interventions in the past were more generic, but as research continues, these interventions are directed more specifically at those with FASD.
Another factor that is increasingly being recognised is the importance of early recognition and intervention for an individual’s vulnerability associated with FASD to reduce the impact of abuse and neglect. Complex trauma models are increasingly being investigated; with this comes the understanding that psychological challenges overlay neurological functioning, which cancan further impact on an individual’s behaviour and presentation. Even if the neurological deficits remain, understanding the person’s needs and not perpetuating extra trauma leads to a better quality of life overall.21,22
Interventions
What remains vital is not just the diagnosis, but also an understanding of an individual’s function and then subsequently what interventions can be offered to change an individual trajectory. This can be led by the diagnosis, pointing towards the specific needs. These interventions can also be multidisciplinary. Pharmacological interventions alongside social and psychological interventions offer the best overall approach to improving an individual’s presentation.
For example, several studies have suggested that by understanding the individual with FASD can help modify medical treatment pathways. One such was a consensus pathway for comorbid ADHD; this identified that routine approaches for ADHD might not always be appropriate. Based on the wider profile and comorbidity linked to the FASD, treatments would need to be changed to meet the individual’s needs.23
The same can be said for psychological interventions, where it is understood that due to underlying problems with emotional recognition and the underlying cognitive deficits, some emotion-focused approaches do not work as well as educational approaches designed to build on strengths and support teaching around the deficits.24 Several interventions have been created and continue to be developed. Parenting involvement is an area where there is great scope for immediate intervention that could have significant benefits. These are examples of specific interventions for FASD that are currently going through testing and clinical trials.
Conclusions
FASD is a common condition that presents often as an invisible disability. Because superficially, individuals can appear to function reasonably well and test reasonably well in clinical settings, this can belie an individual’s actual level of function when wider factors are borne in mind. Complex cognitive processing is often missed, leading to attributions of difficulty and blame which may be inappropriate. It is only by early recognition and bespoke individual intervention that change can be made.
References
First published on our sister publication Hospital Pharmacy Europe
The creation of a Fluid Stewardship Committee at Royal Blackburn Hospital has led to better systems, processes and innovations to support effective intravenous fluid prescribing and management.
I first heard the term ‘fluid stewardship’ in a corridor conversation with our Acute Care Team lead nurse, Jane Dean, in 2019; who, in turn, had only recently come across it in a tweet from the International Fluid Academy.1 The term struck a chord; it sounded like ‘antimicrobial stewardship’, so surely must be about everything to do with the safe and effective management of fluids in hospitals?
The term appears to have been coined in the mid-2010s, with most definitions focusing on the clinical aspects of fluid management. For example, ‘the primary goal of fluid stewardship is to optimise clinical outcomes while minimising unintended consequences of intravenous fluid administration’.2
However, the outcome of the corridor conversation resulted in a more holistic description for my Trust – we wanted to cover all aspects of fluid management and developed a list (Figure 1) that we circulated to some like-minded, ‘fluid-thinking’ colleagues.
Within a fortnight, the Trust’s Fluid Stewardship Committee was formed, with multidisciplinary membership from the consultant body, nursing, pharmacy, and Quality & Safety. Our aim was to examine and optimise all the areas on our list.
The remainder of this article describes our journey so far; a follow-up article will describe how the developments mentioned have progressed.
The committee initially met fortnightly while we assessed what was required, and who should take responsibility for what. The professional leads took responsibility for the educational elements for their respective professions, although there was much overlap.
The pharmacy elements were led by me with support from two colleagues. Our Quality & Safety lead kept us all in check; sticking to the agenda and helping figure out how we could measure outcomes.
The National Institute for Health and Care Excellence (NICE) published Intravenous fluid therapy in adults in hospital3 in 2013, and which was the standard used to develop our educational programme and support materials. It describes how to assess and prescribe fluids for the most common indications (with caveated exclusions for patient groups with more specialised fluid prescribing needs).
It introduces the concept of ‘The 5 Rs’: Resuscitation fluid; Routine maintenance fluid; Replacement fluid; and Redistribution fluid; showing algorithms for each element covering assessment and prescribing, with the fifth ‘R’ Reassessment underpinning them all.
On one level, this is all one needs to know to manage those scenarios; however, there are many myths perpetuated from the time before the guidance, with many having been developed through the perceived wisdom of practice rather than being taught.
There is a paucity of education in Schools of Medicine, Pharmacy and Nursing surrounding the teaching of fluid prescribing, with mnemonics such as ‘one bag of salt to two bags of sugar’… or is it ‘two bags of salt to one of sugar?’ persisting with some of the more experienced clinicians.
And this custom gets passed down the years, resulting in large volumes of sodium chloride 0.9% being inappropriately prescribed and administered, giving patients (irrespective of their body weight and fluid requirements) 154mmol of sodium and chloride with every litre infused: which is more than twice the daily requirements for a 70kg individual.
Harm can and does occur. The National Confidential Enquiry into Perioperative Deaths reported that up to one in five patients who had received IV fluids suffered from complications or morbidities due to inappropriate prescribing or administration.4
Our first task was therefore to try to break this cycle of ‘fluid learning’.
Key to improving fluid stewardship was disseminating the right knowledge to the doctors, pharmacists, and nurses. To achieve consistency of message, and to ensure all important elements of fluid management were covered, we decided to produce a suite of short films describing:
The films were made with the assistance of Dr Justin Roberts (ICU Consultant with a fluid interest), who is also a key member in the Fluid Stewardship Committee and has helped drive the prescribing effectiveness side of the programme.
A fifth film examining fluid balance in more detail is now included in the suite.
Our films were uploaded to a new fluid stewardship page of the intranet, with additional summary points under each embedded film to act as aide memoirs once each film had been viewed. The films have also been posted on the Trust’s internet, so a wider audience can view them and perhaps use them as educational tools, or inform their own fluid stewardship programmes.
Nurse practice educators were charged with informing the nursing staff; the critical care directorate consultant training lead took responsibility for doctors, and I arranged a series of education events for pharmacists and pre-registration pharmacists, with our induction programme for new pharmacists including a fluid stewardship element. Since July 2021, I have also delivered a fluid stewardship training session to the new FY1 intake as part of their core induction.
We are fortunate in that the Trust has made significant investment in the pharmacy team through our Dedicated Ward Pharmacy service. This means most wards have a dedicated pharmacist, with enhanced pharmacy technician resource, so pharmacists can routinely participate in the daily consultant-led, multi-disciplinary ward rounds where they can actively influence all aspects of prescribing (including fluids), as well as being proactive in discharge planning (which was historically an oxymoronic term).6,7
Pharmacists, empowered with the knowledge of our fluid stewardship programme, have become, in effect, ‘practice educators’ and ‘fluid stewards’ for the pharmaceutical aspects of fluid management on each ward.
The recommendation of CG174 for routine maintenance fluid is to use a ‘balanced fluid’ that delivers the basic daily water and electrolyte requirements for an adult. That is:
Historically we had used sodium chloride 0.18% in glucose 4% with potassium chloride (0.15% or 0.3%), which is complicated to prescribe, and get right on a paper prescription chart (the Trust does not yet have electronic prescribing).
Our fluid supplier (Baxter) recently introduced a product called Maintelyte,8 that closely matches CG174’s recommendation for maintenance fluid content. The shorter, memorable, and more meaningful name was an attractive way to make prescribing for this indication easier, safer, and effective, so we sought and gained approval to use it in the Trust from the Medicines Management Board.
It was launched at the beginning of December 2020 with communications through the various professions’ channels within the Trust, and posters in treatment rooms, and was referred to in our engagement film on routine maintenance fluid.
Reassessment is an important aspect of routine maintenance fluid monitoring, and we recommend checking electrolyte serum concentrations two to three times a week. Maintelyte® contains 20mmol KCl in each litre bag, which equates to around 0.5mmol/kg/day potassium if dosed correctly, so occasional supplementation of additional potassium with our original maintenance fluid is required.
Historically nurses could request fluids from pharmacy stores on an order sheet that contained around 30 different fluids that were often ordered by ward housekeepers several times each week; this was quite inefficient for picking and deliveries.
We changed stock orders of fluids, so that they are now generated weekly by pharmacy assistants, which are topped-up when the regular stock medicines are ordered for each ward. This has resulted in time efficiencies because each ward now typically only receives one fluid order/week, which in most cases can be accommodated on the ward because fluids used infrequently have been removed.
If a patient has a genuine need for a less frequently supplied fluid, this must now be screened by a ward pharmacist to sense-check it is appropriate, and, if necessary, an individual supply will be ordered.
With the introduction of Maintelyte, members of the pharmacy team took the opportunity to review, with each ward manager, what their wards empirically needed. This included removing some fluids that did not appear to have an indication and adding Maintelyte on to each stock list. Initially the amount stocked of each fluid was a best guess, and we have monitored each ward’s usage with subsequent tailoring of quantities.
Figure 2 shows the effect on the two fluids that Maintelyte ostensibly replaces; however, its use across the Trust far exceeds what was replaced, possibly suggesting the ease of prescribing has led to increased usage. However, the baseline prescribing audit shows things in a different light.
With all these changes we wanted to get an idea of how well fluids were being prescribed, prior to further developments being introduced. We were fortunate to have a fourth-year medical student with an interest in fluid stewardship, and in need of an audit, so an audit was designed and tested on two medical wards in February 2021.
The primary aim was to collect and analyse Trust-wide baseline data on fluid prescribing in relation to the standards in NICE CG174. It was also hoped to identify any barriers to appropriate fluid prescribing and evaluate the impact of education on fluid prescribing standards.
Figure 3 shows the audit’s findings of whether the indication for a fluid prescription was recorded in the notes. In half the prescription charts examined no clear indication was documented; what was not examined, and might feature in a future audit, is whether the indications that were captured were accurate and appropriate for the clinical situation of the patients.
Our current prescription chart does not provide space to capture an indication for a fluid, although it does for other regular or when-required medicines. The audit provided evidence of patients’ weights being recorded (70% were recorded; 30% were not) which has a significant bearing on a pharmacist’s ability to clinically check the appropriateness of the volume of fluid prescribed for routine maintenance, redistribution, and resuscitation.
The audit examined the frequency of types of fluid prescribed (Figure 4) and correlated this with the indication. As well as reinforcing the lack of indication in half of the prescriptions we found that fluids were being prescribed for an inappropriate indication; for example, Plasma-Lyte 148 was used as routine maintenance in one patient; sodium chloride 0.9% had been erroneously used, where the indications were recorded, when our guidance was to use Plasma-Lyte 148 prescribed for redistribution and resuscitation and Maintelyte for routine maintenance; and Maintelyte had been used for redistribution when its sole indication is routine maintenance.
The volumes prescribed were recorded, with 93% (n=28) being 1000ml and 7% (n=2) being 250ml. A tailored volume should be prescribed for replacement, redistribution, and routine maintenance such that, when rounded to the nearest 100ml, volumes other than 1000ml prescribed in many cases would be expected.
Junior doctors were asked to complete a questionnaire in the same period the audit took place to capture their perceptions and understanding of fluid stewardship.
The results are shown in Table 1 and perhaps explain the audit findings, with junior doctors confident in their prescribing of fluids, although the audit shows this is starkly misplaced; feeling they receive good training as an undergraduate, while slightly less so on the job; and that they would benefit from further training… although none of them had watched the films on the intranet.
Clearly there is much work to do regarding the education and engagement of junior doctors. The fluid stewardship induction session for new foundation year doctors will help, but we have two other developments in the pipeline for 2021 that should make it easier for prescribers to perform a safe and effective job when prescribing fluids.
The Trust is about to introduce a new paper prescription chart (a 12-page booklet) ahead of electronic prescribing in late 2022. The fluid section has been extensively revised to support our fluid stewardship programme, and now appears as a gatefold section with printed reminders of how to prescribe fluids for different indications (Figure 5), with a separate section for resuscitation fluid, and checkboxes to show the other fluid indication(s) (Figure 6).
The concept of using a smartphone application to help prescribers choose the right fluid and the right dose volume came out of conversations with the Fluid Stewardship Committee. Anyone watching our educational films, viewing the key points on the intranet, and supported by the new prescription chart should have the empirical knowledge to prescribe fluids effectively; however, we really wanted to make it easy to do an effective job.
The critical care team had been using an app that we had devised a few months earlier – Blippit Meds. This was originally designed to help nurses quickly view injectable drugs’ monographs in the treatment rooms without having to rely on paper copies or computers; they could access them on their smartphones.
We approached our app developer to see if a fluid decision aid could be made that followed the principles of the NICE CG174 prescribing algorithm, and with some simple choices and inputs, for example, a patient’s weight, could show the right fluid choice and volume for a given clinical situation. It turns out this was possible, and at the time of writing the final development phase is taking place and will launch as soon as it is registered as a medical device.
A training film has been developed, showing clinicians how to use the Blippit Meds fluid prescribing decision aid as well as the injectable monographs section. This can be seen at https://bit.ly/BlippitMeds.
As an example, the composite screenshot in Figure 7 illustrates the routine maintenance calculator; one of three calculators in the app. Key ‘smart’ features have been included to ensure that variables such as comorbidities, ongoing intravenous antibiotic volumes are included when working out dosing, and finally it shows the dose and choice of fluid based on the user’s total inputs.
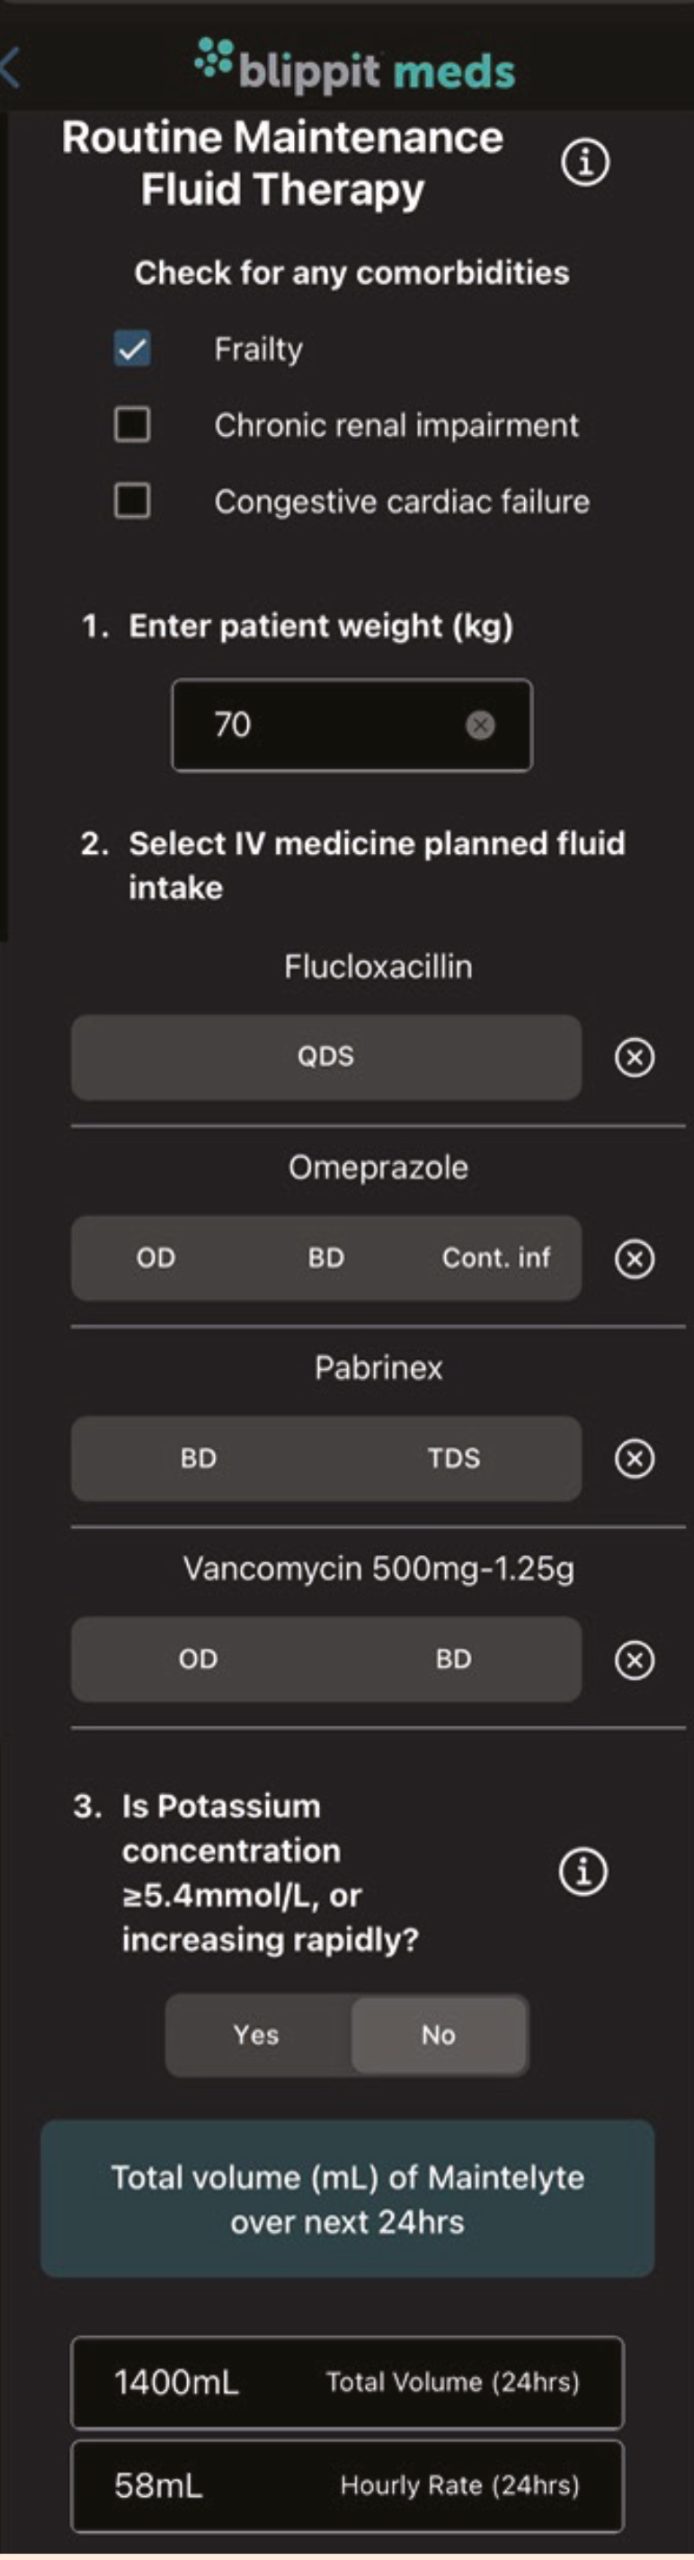
For all three calculators, if additional fluids selected means the calculated volume is in the range 0–200ml, then a pop-up message appears suggesting no extra fluid is required today and to reassess the next day. If the volume of additional fluids exceeds the calculated volume, then a separate pop-up message appears warning the clinician there is a risk of fluid overload and they should consult a senior decision-maker.
Our imperative is to successfully launch the new prescription chart and the Blippit Meds app, with appropriate communications to the Trust’s clinicians. The pharmacists delivering our Dedicated Ward Pharmacy service will be well placed to support prescribers and nurses to utilise these two new innovations.
Ward fluid stocklists will also be reviewed again to ensure the range of fluids and volumes match changes in demand. And then, we will re-audit the fluid prescriptions to see if all the changes have improved the quality of prescribing, and take whatever action is necessary to address any concerns raised, or hopefully have a warm sense of achievement of a job well done!
To find out what happened next, look out for Part 2 of this series (coming soon), and, in the meantime, perhaps consider how you could introduce a fluid stewardship programme in your organisation and become good ‘fluid stewards’.
First published on our sister publication Hospital Pharmacy Europe.
21st February 2023
Neonatal parenteral nutrition and its delivery is a complex process, with very specific requirements. A multidisciplinary team can offer expertise to ensure adequate nutrition to avoid deficits and promote growth while reducing any associated risks.
Providing parenteral nutrition (PN) to babies is a complex process. Multidisciplinary teams (MDTs) can have a unique understanding of the specific nutritional requirements and can offer added expertise in ensuring adequate nutrition to avoid deficits and promote growth, while reducing the risks associated with PN, including during the transition to full enteral feeding.
Appropriate nutrition is essential for growth and development.1–3 Neonates who are unable to tolerate adequate enteral nutrition will require PN. Total parenteral nutrition (TPN) describes a situation whereby all nutrition is delivered intravenously; however, PN is often used in the neonatal unit in conjunction with enteral feeds, either to maintain nutritional intake as milk feeds are increased or for babies in whom full enteral intake is not tolerated (for example, in cases of short bowel).
PN administration should be based on nationally agreed evidence-based guidelines, recognising that the evidence base for neonatal PN can be limited.4,5 To date there has been no randomised controlled clinical trial of neonatal PN powered to examine longer-term outcomes including neurodevelopment and cardiovascular health. The 2020 National Institute for Health and Care Excellence (NICE) guideline for neonatal parenteral nutrition is the most comprehensive review of the current evidence.6 This guideline covers PN for babies born preterm, up to 28 days after their due birth date and babies born at term, up to 28 days after their birth.
The guideline provides recommendations on:
PN should be considered in any neonate who is unlikely to meet the nutritional requirements via the enteral route, either due to immaturity or illness. Premature infants, and especially those of extremely low birth weight, are particularly vulnerable due to their low nutritional reserves.7 Early provision of nutrition for preterm infants is associated with improved weight gain and head growth.8 When a baby meets the indications for PN, it is advised to start it as soon as possible, and within 8 hours at the latest.6
The absolute indications are summarised in Table 1.
The scope of the NICE guideline6 only covered PN for babies born preterm, up to 28 days after their due birth date and babies born at term, up to 28 days after their birth.
However, there will be babies who will require PN for longer periods due to factors that limit enteral intake. As part of the guideline development, NICE considered whether nutrition care/support teams are effective in providing parenteral nutrition in preterm and term babies. The literature review identified no randomised controlled trials; therefore, observational studies were included to inform decision-making.
Four observational studies were identified by NICE.9–12 Two involved cohorts of surgical patients,9,10 whereas the others looked at cohorts of preterm infants.11,12 The lack of robust trials in this area can be seen from the fact that in all categories considered, the NICE team found the evidence to
be of very low quality; however, experience has shown that the involvement of an MDT can improve outcomes.
Outcomes will potentially be influenced by the composition of the MDT which can include professionals from gastroenterology, neonatology, general surgery, nursing, nutrition, pharmacy, social work, and occupational therapy, depending on the individual patient. Not all disciplines will be involved in all patients. The current evidence does not enable the exact determination of an MDT to be detailed but indicates that there is a role for this team. The composition will likely be determined by the clinical condition of the baby and its severity. The report in 2011 by the Paediatric Chief Pharmacists Group recommended that all children have access to a competent MDT, with a minimum composition of a doctor, pharmacist, nurse and dietitian.4 The exact structure of an MDT will depend on the caseload and the patients that are seen. An MDT can be network-based.
Not all babies will require longer-term management by an MDT. A lot of babies, particularly those not in Level 3 units, will only be on PN for a short period and standard bags are appropriate for these patients. For others, for example, in cases of CDH, there might be fluid restrictions, which together with multiple drug infusions limit the volume for nutrition. In these cases, the MDT has a significant role to play in optimising nutrition.
The neonatal consultant will generally be the team member with an overall view of the patient’s condition and will, generally, be the one to make the decision for commencing PN for patients who fall outside the absolute criteria above. For babies falling under surgical conditions, for example in CDH, then a surgeon will have a major input into the nutrition regime, particularly regarding the introduction of enteral feeds. For babies on long-term PN at risk of PN-associated liver disease (PNALD), then a gastroenterologist will also be required.
The nurse will be the healthcare professional who will be spending the most time with the patient and will be monitoring associated items like fluid balance and line condition. The NICE guideline has given ranges for the osmolality of solutions that can be run peripherally. This will be a change in practice for some units and might require more stringent line management, particularly for peripheral cannulae.
Following the introduction of non-medical prescribing in 2004, prescribing of PN was seen as a natural progression for pharmacists as they had been involved in the formulation of PN for many years. Having a pharmacist as a member of the MDT, particularly attending ward rounds for babies on PN, will help to reduce prescribing errors,6 and ensure suitability, from a chemical compatibility view, of the proposed regimen. This would be done in liaison with a pharmacist in the pharmacy aseptic unit, to discuss the validation and clinical appropriateness of any amendments to the formulation with the prescribing pharmacist.
Enteral feeding was outside the scope of the NICE guideline so there were no recommendations around the transition to enteral feeds from PN. However, nearly all babies on PN will transition to full enteral feeding at some point, and this crossover as feeds increase and PN reduces can lead to a nutritional gap. Dietitians play an important role in recommending optimal enteral nutrition for these patients.
The MDT will not be the only factor influencing PN provision and duration of treatment; for example, gestational age is also a factor. Critical outcomes identified by NICE were anthropometric outcomes, prescribing errors, and achievement of target intake. The latter two, in particular, can be influenced by the MDT. Although the evidence around the benefit of an MDT is low quality, knowledge and experience have shown these teams to be effective, particularly for babies with complex needs.
Access to these core professionals, with access to other fields of expertise where needed, for example, surgeons or gastroenterologists as listed above, to provide additional clinical support, will help to provide optimum PN for neonates. This additional expertise can be network-based as not all units will have this additional support on site, and would be called upon as required for specific patients
So, the question is not whether an MDT is required for neonatal PN – experience has shown that it is beneficial – but what is the ideal composition for such a team. However, further research is required in this field to continue improvement in the provision of PN to neonates.
Peter Mulholland MSc FRPharms
First published on our sister site Hospital Pharmacy Europe
This article discusses some of the enhanced recovery after surgery (ERAS) strategies that can be employed in optimising long-term conditions peri-operatively to achieve the best possible patient outcomes
The World Health Organization has estimated that approximately 234 million surgical procedures are performed worldwide each year.1
Although most of these procedures are uncomplicated, an increasing number of individuals are at risk of adverse outcomes because of comorbid conditions and poor functional capacity.
At age 65, some 50% of the UK population has multimorbidity, defined as two or more long-term conditions, and this proportion rises with age and deprivation.2
Complications that prolong length of stay occur after approximately 15% of inpatient operations, which can be mitigated by optimising patients for surgery.3
One of the key stages of enhanced recovery (ER) is optimising patients for surgery. The concept of ER was first pioneered in Denmark in the late 1990s for patients undergoing colorectal surgery.4
Since their introduction in the UK in the early 2000s, ER pathways have been successfully implemented within various surgical specialities in the UK, the primary aim being to reduce the length of stay while still providing a high-quality package of care.
Fundamental to all aspects of ER is that patients are ‘partners in their own care’ and are kept fully informed throughout their surgical journey.
It is crucial that assessment and preparation for surgery starts as soon as possible adopting a multi-modal, trans-disciplinary approach.2 Primary care physicians can play a major role in identifying the modifiable causes of increased morbidity; for example, smoking, reduced physical activity, excess alcohol and poor nutrition prior to referral for surgery.
Pre-assessment clinics (nurse-, anaesthetist- and pharmacist-led) are also crucial in identifying these ‘high-risk’ patients with multiple comorbidities at risk of post-operative complications: for example, pre-existing anaemia, diabetes, cardiovascular and respiratory disease.
In line with the ER initiative, a pharmacist-led Enhanced Surgical Medicines Optimisation Service (ESMOS) was implemented in a large 1200-bedded tertiary hospital in Central Manchester in September 2017 to mitigate the risks of post-operative complications and optimise post-operative care.5
The goals of the ESMOS service are to identify high-risk surgical patients once they are listed for surgery and get them in the best possible state for surgery by focusing on optimising their pre-existing comorbidities.
During the pre-operative phase, patients are reviewed in a virtual pharmacist clinic whereby patients’ pre-existing medical comorbidities are recorded by pharmacists along with any high-risk medication the patient is taking.6,7
The goal at this stage is to optimise long-term conditions prior to surgery. The ESMOS was initially rolled out to four main general surgical sub-specialties: hepato-pancreato-biliary (HPB); upper gastrointestinal (GI); lower GI; and vascular surgery.
The results of the 12-month follow up study following implementation of the ESMOS service demonstrated a significant reduction in length of stay and post-operative complications.6
Pharmacists can play a key role in identifying patients with co-morbid conditions and optimising these prior to surgery as time allows. Figure 1 summarises the key areas of optimisation.
Over the next section, strategies that can be employed in optimising these comorbid conditions are discussed in more detail.
Thorough assessment of cardiac morbidity is particularly important for high-risk surgical patients. The revised cardiac risk index is one of the most validated and widely used risk assessment tools for predicting peri-operative risk in patients with cardiac comorbidities.7
Hypertension alone is only a minor independent risk factor for adverse cardiac events in non-cardiac surgery.7 Postponement of planned surgical procedures due to elevated blood pressure is a common reason to cancel necessary surgery.
The Joint Guidelines from the Association of Anaesthetists of Great Britain and Ireland and the British Hypertension Society have produced a consensus statement stating patients with clinic blood pressures below 180mmHg systolic and 110mmHg diastolic should not have their surgical procedure delayed.8
Patients with stage 3 hypertension (BP >180mmHg systolic /110mmHg diastolic) should have their surgery delayed with BP optimisation and allowing a minimum of 4-6 weeks of treatment following the National Institute for Health and Care Excellence/British Heart Society CG127 algorithm.8
Patients presenting with stage 1 (BP 130–139mmHg systolic or 80–89mmHg diastolic) or stage 2 hypertension (BP >140mmHg systolic or 90mmHg diastolic) are considered safe to proceed to surgery.8
It should be noted that patients with diastolic pressure ≥110mmHg immediately before surgery have been shown to have increased risk of complications including myocardial infarction and renal failure.9
Heart failure is a global problem, with at least 26 million people affected.10 The prevalence of heart failure is also increasing as the population ages, and more patients with congestive heart failure will present for surgery.11
In patients with acutely decompensated heart failure (New York Heart Association class IV), surgery should be postponed, if possible, and the opinion of a cardiologist sought for titration of heart failure medication.7 Pharmacists can play a vital role in up-titration of heart failure medication in this crucial period.
Pre-operative optimisation of lung function helps to reduce post-operative pulmonary complications.12 Patients are advised to stop smoking for a period of four to six weeks. This reduces airway reactivity, improves mucociliary function and decreases carboxy-haemoglobin.12 Pharmacists can help promote smoking cessation advice to these ‘at-risk’ patients.
Incentive spirometry pre-operatively has also proved to be effective in reducing post-operative pulmonary complications.13
Pharmacists can further support patients by providing the appropriate counselling on correct inhaler technique and checking compliance. Patients with symptomatic asthma should have their treatment increased until symptom control is achieved.14
Approximately 4.5% of the UK population aged over 40 years are affected by chronic obstructive pulmonary disease (COPD).15
For the care of COPD, the updated National Institute for Health and Care Excellence (NICE) guidance emphasises ‘five fundamentals’ of chronic obstructive pulmonary disease care: offer treatment and support to stop smoking; offer pneumococcal and influenza vaccinations; offer pulmonary rehabilitation for people with COPD (if indicated); co-develop a personalised self-management plan; and optimise treatment of comorbidities.16 Postponement of surgery is advisable only after a recent exacerbation.13
Peri-operative hyperglycaemia, whether the cause is known diabetes, undiagnosed diabetes or stress hyperglycaemia, is a risk factor for harm, increased length of stay and death.17,18
The Centre for Peri-operative Care (CPOC) in the UK has published guidance on the peri-operative care for patients with diabetes mellitus undergoing elective and emergency surgery.19
Ideally, diabetic patients should be optimised at the time of referral from primary care.17 In situations where this is not possible, advice from the diabetes team should be sought as soon as possible to facilitate optimisation.
The key recommendations from the CPOC guideline are that pre-operative assessment clinics should refer all patients with a HbA1C of 69mmol/mol and above, an insulin pump or a continuous subcutaneous insulin infusion (CSII) to a specialist diabetes team for treatment optimisation.19
Another recommendation from this document is that pre-assessment clinics should work where possible, with the pharmacy team to ensure medicines reconciliation prior to admission to reduce medication errors including a system for patients to report changes to their medication between their pre-operative assessment and date of surgery.
Ideally, diabetic medication should be pre-prescribed prior to admission and for best practice rescue treatment should also be pre-prescribed for looming hypo- or hyperglycaemia.19
Pharmacists can use this vital time adequately to promote lifestyle interventions such as smoking cessation, lifestyle modification, reduction in alcohol intake, optimal nutrition and weight management.
It has been estimated that approximately 40% of patients presenting for surgery are anaemic.20 Pre-operative anaemia is associated with significantly higher rates of morbidity and mortality and increased need for blood transfusion.
Patients undergoing major surgery (defined as blood loss >500ml expected or possible) should be optimised if their haemoglobin concentration is less than 130g/l on screening.
Detection of pre-operative anaemia should be carried out as soon as possible, at least 14 days before elective surgery.21
Figure 2 suggests a treatment algorithm for different types of anaemia from diagnosis to surgery based on an international consensus statement as described by Munoz et al.22
Treatment of iron deficiency anaemia should be carried out with iron supplementation, and there is good evidence that this results in higher haemoglobin concentrations, lower transfusion rates and better quality of life.21 When the interval between investigation and surgery is sufficient (>6 weeks), oral iron treatment may be considered.21
Pharmacists can play a key role in optimising pre-operative anaemia by identifying affected patients in the first instance, interpreting laboratory results and working with the wider multi-disciplinary team to ensure a management plan is in place to correct the anaemia.
An increasing number of patients considered for surgery are on anticoagulants hence it is important that these are managed appropriately in the peri-operative period to reduce the incidence of thrombotic events.
The British Society of Haematology has published guidelines on the peri-operative management of anticoagulation.23 Pharmacists can support pre-assessment clinics by ensuring these patients have an appropriate management plan in place.
For those patients on warfarin, this should be stopped for five days prior to surgery and bridging-dose heparin should be considered in high-risk patients, with the last dose at least 24 hours prior to surgery for those on a once-daily regimen.
For patients on direct oral anticoagulants, the peri-operative management approach is based on an approximate calculation of the half-life of the drug and renal function. This is combined with consideration of the bleeding risk of the proposed procedure and a clinical evaluation of the patient’s individual risk factors for bleeding and thrombosis. Where available, local guidelines should be consulted and advise sought from specialist haematology teams in complex patients.
This article summarises some of the strategies that can be employed in this crucial pre-operative period to optimise patients for surgery to achieve the best possible patient outcomes. It is recognised that the surgery waiting lists in the UK already under pressure have been further increased by the COVID-19 pandemic. These waiting lists provide a unique opportunity for multidisciplinary teams to work collaboratively, further supporting the concept of enhanced recovery.
First published by our sister publication Hospital Pharmacy Europe.
20th February 2023
Frail older people often have multiple comorbidities and thus take multiple medications, some which may be inappropriate and lead to adverse effects. Optimising medication in the frail older person is vital and leads to safer clinical outcomes
Frailty is a distinctive health state correlated to the ageing process in which there is a decline in the body’s physical and psychological reserves.1 It is estimated that 10% of people aged over 65 years have frailty, which increases to half of those over 85 years.2
Frailty in older people is characterised by reduced resilience to external stressors, reduced mobility and reduced functional reserve.1,3 Older frail patients are extremely vulnerable to minor events such as an infection or new medication.1 This results in frequent hospital admissions with geriatric syndromes such as falls, immobility, incontinence, confusion and susceptibility to adverse effects of medicines.1 Frail patients are at a higher risk of adverse outcomes including major changes to their physical and mental health. Ultimately, this increases the length of hospital admissions as recovery is a slower process, increasing risk of mortality. Older frail patients are typically more functionally dependent on others and might reside in a care facility.2,4
Establishing whether an older patient has frailty is important in order to meet their care needs and this can be undertaken using simple methods such as the Frailty Phenotype and Prisma-7.4,5 The Frailty Phenotype involves evaluating five criteria: unintentional weight loss; physical activity; exhaustion; weakness; and walking time.4 Similarly, the Prisma-7 is a questionnaire comprising seven questions that patients can self-complete. For both assessment tools, a score of ≥3 suggests the patient is frail. Additionally, after completing a comprehensive geriatric assessment (CGA) a scoring system can be used to examine the severity of frailty using tools such as the Rockwood Clinical Frailty Scale, Edmonton Frailty Scale and Gait Speed Test.6 CGA is the gold standard that includes a holistic, multidisciplinary team assessment of the older patient, showing a 30% higher chance of being alive and in their own home at six months (number needed to treat = 13).6
Polypharmacy is defined as taking five or more regular medications, which is commonly observed in older frail patients because multimorbidity leads to increased number of prescribed medication.7–10 Older patients are commonly observed having multiple medications, due to them having multiple comorbidities. Traditionally, polypharmacy was defined as taking more than five medications. More importantly, a thorough assessment is required to identify whether the medication is appropriate or inappropriate. Appropriate polypharmacy refers to each medication having a clinical indication that has an evidence base.11 Inappropriate polypharmacy refers to medication where the risk is greater than the benefit and there is little or no evidence base.11
Studies have shown that a significant number of medications taken by older frail patients lack clear indication, hence causing further complications for older frail patients. The results from a study carried out by Hanlon et al indicated that more than 90% of frail inpatients took at least one inappropriate medication.12 Furthermore, 5–11% of medications taken by older patients were identified as unintentional duplication of treatment for the same indication.13,14
Polypharmacy over the years has been characterised as a key element contributing to adverse events. However, it is difficult to establish whether the adverse events are a result of taking multiple medications or the progression of comorbidities in older frail patients. Appropriate polypharmacy can be achieved if individual needs, preference and goals of care are assessed accurately and appropriately. In patients who are generally mobile and functionally independent, prescribing multiple drugs will not be problematic. In contrast, frail patients would require a different approach as the predominant goal of medical therapy may be relieving symptoms of disease progression and maintaining function.7
Prescribing multiple medicines in older patients to some extent has contributed to hospitalisation and mortality. The risks involved with polypharmacy in older frail patients includes adverse drug reactions and also has the potential to cause long-term cognitive impairment, delirium, falls, urinary incontinence and unintentional weight loss.8,11 This is largely a consequence of the increased sensitivity to medication due to age, multiple comorbidities and impaired hepatic or renal function.6,11
Another risk associated to polypharmacy involves the following interactions: drug–drug, drug–disease and drug–geriatric syndrome (for example, use of anticholinergics in patients with risks of urinary incontinence and falls).14,15 The risks of adverse drug reactions can also be exhibited by specific classes of medicines such as, anticholinergics, anticoagulants, antiplatelet, antihypertensive and antidiabetics, which can be more harmful than beneficial when prescribed in older frail patients.1,6,12,16
The prescribing of medicines has increased substantially due to an aging population with multimorbidity. This has a massive cost implication to the healthcare economy. Medicines optimisation is a process that aims to achieve ‘a person-centred approach to safe and effective medicines use, to ensure people obtain the best possible outcomes from their medicines’.17 In England approximately 10 million people have two or more long-term conditions, 1 million with frailty and 0.5 million are at end of life.18 Therefore, medicines optimisation is significant to improve medication adherence through multidisciplinary working, which leads to better health outcomes and reduces medication wastage.11,17
The use of medicine in older people aims to reduce disease progression, cure disease or manage symptoms, as the prevalence of chronic disease develops with age.16 However, it is important that the selection of medication is appropriate as older people are also at greater risk of experiencing adverse drug events. Inappropriate prescribing involves the use of interacting drug combinations, ineffective drugs and multiple drugs for the same indication without adequate optimisation.10 As a result, this leads to an increase in the pill burden and hazardous prescription cascades.
The factors that influence the choice of medical treatment in older people include therapeutic aims, pharmacokinetics, pharmacodynamics, and efficacy.11 These factors are subject to change with age and vary significantly between individuals of the same age. Therefore, reviewing all medicines in older people is fundamental to achieve safe and appropriate therapeutic goals.
Deprescribing is a complex process that requires careful consideration to balance the potential risks versus benefits of withdrawing medications to improve clinical outcomes.2
The barriers that may discourage healthcare professionals to deprescribe medication include:15,19
Where multiple medicines are used to treat long-term conditions, it is important to establish the patients understanding of their condition and address any concerns about their medication to support their adherence.20,21 Over time, the patients’ needs and suitability of medication will change, exploring these during the consultation aids successful medicines optimisation and deprescribing. For example, if non-adherence is identified, investigating the reason improves patient–clinician relationship, health benefits and reduces hospital admissions as older patients may stop and start their medication without consulting a doctor using their own understanding of the medicines prescribed in managing their symptoms.20
In order to achieve these outcomes, the National Institute for Health and Care Excellence (NICE) has provided guidance for carrying out structured medication reviews. Ideally, medication reviews should be carried out annually as standard practice and more frequent reviews should be considered if necessary, particularly in older frail patients with chronic or long-term conditions and polypharmacy.20,21 Various tools can be used to identify polypharmacy and assist with deprescribing such as STOPIT, STOPP/START and BEERS criteria.
NICE guidance on shared decision-making states that during a medication review, all patients should be given the opportunity to be involved in making decisions about their medicines.Assumptions on the patient’s values, preferences, level of participation and capacity to make decisions should be avoided. The principles specified in the Mental Capacity Act 2005 should be used to assess the patient’s capacity to make each decision.20 These discussions help to identify what is important to the patient about managing their condition(s) and their medicines.
The Kings Fund also highlighted that there is strong evidence suggesting that better outcomes are achieved when patients actively contribute in manging their health in comparison to those who are inactive recipients of care.22 Therefore, shared decision-making should become the principal mechanism where this is ‘no decision about me, without me’ to ensure that patients get the care they desire and require.22 All healthcare professionals undertaking medication reviews should implement this in their practice to standardise care.
When initiating treatment in older people the lowest effective dose should be prescribed and then titrated up slowly to prevent adverse drug reactions. This approach provides cost-effective treatment with better health outcomes.23 Pharmacists play a key role in the selection and optimisation of medication that is safe and appropriate in frail older people as well as safely deprescribing any inappropriate medication.
Vimisha Hirani MPharm PG Dip GPP
Frailty Pharmacist, Northwick Park Hospital, UK
Paresh Parmar MSc MRPharmS
Lead Care of Older People and Stroke Pharmacist, London North West University Healthcare NHS Trust, UK
First published on our sister publication Hospital Pharmacy Europe
People with severe mental illness die about 10–20 years earlier than the general population, mainly due to physical health disease. Evidence about the role of the pharmacist and pharmacy in optimising care in this vulnerable patient population is provided in this article
People with severe mental illness (SMI), defined here as bipolar affective disorder, schizophrenia, schizoaffective disorder and other non-organic psychotic disorders, are at a substantially higher risk of premature death, in that they die 10–20 years earlier than the general population.1,2 SMI represents a leading cause of the global burden of disease with high morbidity rates and an estimated excess mortality of 1.5–3-times higher than the general population.3 While unnatural causes, including suicide, homicide and accidents explain some of this reduced life expectancy,4 it is now firmly established that physical health diseases account for the overwhelming majority of premature deaths.5
Mortality gap and associated factors
The mortality gap exists in countries considered to have high standards of healthcare6–10 and there is also evidence that the mortality gap has increased over time.11,12 This appears to indicate that individuals with SMI have not experienced the same benefits from developments in healthcare as the general population.12 The premature and excess morbidity and mortality in people with SMI has ramifications not only for mental health and all health services but also for human rights and equity. A situation that has been labelled a scandal and in contravention of international conventions for the ‘right to health’.13
Among physical health diseases, cardiovascular disease (CVD) and diabetes are the main potentially avoidable contributors to early death in people with SMI.5 In a comprehensive meta-analysis of CVD risk in individuals with SMI, which included 3,211,768 patients and 113,383,368 controls, individuals with SMI had a statistically significant increased risk of coronary heart disease (CHD) compared to controls; a 54% higher risk in longitudinal studies and 51% higher risk in cross-sectional studies.14 Studies have reported that among patients diagnosed with diabetes, those with SMI have 50% higher mortality15 and an increased risk of complications requiring specialist treatment16 compared to people without SMI. These findings are well substantiated by multiple meta-analyses and systematic reviews.
People with SMI have a higher relative risk (1–5-fold) for modifiable cardiometabolic factors. The prevalence of hyperglycaemia, hypertension, dyslipidaemia and hyperlipidaemia in those with SMI has been reported to be 19%, 33.2%, approximately 48% and 61%, respectively.17–19
Public health data from the UK and the US suggest that around two-thirds of people with SMI are current smokers, approximately double that of the general population.20,21 Literature reviews indicate that people with SMI are 2–3-times more likely than the general population to be overweight or obese.22,23 This might be related to a poor diet as reported in a systematic review and meta-analysis of 58 studies.24
Furthermore, metabolic syndrome (MetS) is one of the most prevalent risk factors for developing CVD in those with SMI.25,26 Thirty-seven per cent of those with chronic schizophrenia have MetS compared with 24% in the general population.27
The World Health Organization (WHO) considers the premature and excess morbidity and mortality in individuals with SMI a public health priority and it is included within the WHO’s Comprehensive Mental Health Action Plan.28
A poor quality of care
Worldwide studies demonstrate that it is now well established that people with SMI receive a poor quality of care for their physical health when compared to the general population, from health promotion and disease prevention and screening through to interventions.29–32 Despite having twice as many contacts with healthcare services, individuals with SMI receive less physical health screening, fewer prescriptions and fewer procedures,33,34 and lower rates of CVD diagnosis even though, as outlined earlier, the risk of these patients dying from CVD is higher.33,35,36 Specific examples include lower rates of surgical procedures such as coronary artery bypass and revascularisation and fewer prescriptions for cardiovascular medication.34,36
The mainstay of treatment for most people with SMI is antipsychotic medication. Antipsychotics are associated with an increased prevalence of CMR, MetS and related diseases including dyslipidaemia, impaired glucose tolerance and weight gain;37,38 the greatest weight gain has been reported to occur during the first few months of use.37,39,40
Marked differences exist in the incidence associated with different antipsychotic medication, the (so-called) second generation olanzapine and clozapine being associated with the highest incidence and aripiprazole, lurasidone amongst others associated with the lowest.41,42 Large-scale observational studies indicate that all-cause mortality is reduced when continuous long-term antipsychotic use is maintained, this is attributed to reduced relapse rates, healthier lifestyles, less psychosis-related cortisol increases, and increased engagement with health services.35,43,44 Judicious prescribing can reduce excess mortality in individuals with SMI. Recent studies and evidence summaries highlight the positive impact on mortality of continuous treatment), appropriate dose ranges, and current and long-term use.
High rates of lifestyle behaviours such as smoking exist but studies clearly and consistently demonstrate that contributory factors to morbidity and mortality extend beyond diagnosis, medication and lifestyle behaviours.1,29 For example, despite the wealth of evidence that a large majority die of CVD, only one quarter receive a diagnosis for this.35 After controlling for whether a diagnosis has been made, the risk of death due to ischaemic heart disease equates almost equal to that of someone in the general population.35
A comprehensive approach is needed to improve the health and longevity of people with SMI; the greatest benefits could be achieved using a multifaceted approach which tackles individual, health system and socioeconomic factors to simultaneously address individual behaviour, health system and social factors.1,29
Addressing excess morbidity and mortality
Guidelines have been developed and disseminated to address this excess morbidity and mortality. These primarily target mental health, lifestyle behavioural risk factors, and screening and management for physical health. As far back as 1995, elements of physical healthcare including CMR, MetS and related diseases were incorporated into government guidelines for SMI in parts of Australia.45 In the UK, guidelines for schizophrenia were first published by the National Institute for Health and Care Excellence (NICE) in 200246 and included recommendations for regular physical health screening. Then, in 2004, as a result of a US Food and Drug Administration (FDA) warning about the association of antipsychotics with an elevated risk of type 2 diabetes, the American Diabetes Association and the American Psychiatry Association published joint guidelines explicitly outlining the need for routine screening for diabetes for people taking antipsychotics.47
Up-to-date versions of these guidelines recommend coordination among mental health and primary care providers, and delivery of general physical health services in mental health settings.37,48–51 Manufacturers of antipsychotics include clear statements about screening and management for CMR, MetS and related diseases in their Summary of Product Characteristics; the prescription of such medication should be in line with this legal document.
Despite the convincing evidence for the association of antipsychotic use and CMR, MetS and related diseases in people with SMI and explicit recommendations provided by guidelines, screening is often incomplete or inconsistent.52
A review carried out in 2012 of 39 internationally published studies reported that rates of routine baseline screening were low (50% solely for blood pressure and 59.9% for triglycerides), less than 50% for cholesterol (41.5%), glucose (44.3%), weight (47.9%) and HbA1c (<25%).52 A review conducted in 2016 suggested that interventions to improve screening for obesity, hyperlipidaemia and hypertension can be effective at improving the detection of CMR, MetS and related diseases.
Delivering parity between mental and physical health
The Health and Social Care Act 2012 (UK) set out a clear and explicitly legal responsibility for the National Health System (NHS) to deliver parity between mental and physical health. Further, secondary care psychiatric/mental health NHS trusts were given financial incentives to work towards meeting indicators under a Commissioning for Quality and Innovation Scheme (CQUIN). This included carrying out and recording screening and management for CMR, MetS and related diseases for people with SMI. Significantly, the scheme mandated communication with the patient’s general practitioner on discharge from secondary care. In the USA, a proposition was put forward that individuals with SMI be considered a health disparity group by the federal government.53 This included a requirement to track health statistics of this population and to provide more opportunities supporting these patients with their health.53
Individuals with SMI represent a vulnerable group with multiple and substantial healthcare needs. The excess morbidity and mortality in individuals with SMI continue to be an important global public health problem. The excess morbidity and mortality in this population are mainly due to preventable physical health illnesses related to CMR, MetS and related diseases. Despite identified and established risk factors for morbidity and premature mortality, evidence for effective interventions for CMR, MetS and related diseases in people with SMI is limited. Pharmacy is increasingly being highlighted as a profession that has the potential to contribute to comorbid physical and mental healthcare in both primary and secondary care settings. However, robust high-quality research supporting the role of pharmacy providing care for CMR, MetS and related diseases in individuals with SMI is lacking.
The role of pharmacy
A literature review explored the use of pharmacy in the management of CMR, MetS and related diseases in SMI.54 An important focus of this review was to explore implementation strategies to improve physical health screening, such as HbA1c for diabetes, and related interventions such as smoking cessation or reduction. This review reported that face-to-face interactions of pharmacists with others, such as patients or healthcare professionals, is a specific aspect that is important in achieving a statistically significant impact on health screening and related interventions. This might be, for example, a pharmacist-led multidisciplinary ward round or pharmacist outreach visits.
This literature review identified gaps in the current evidence base. This included, for example, screening of waist circumference and weight/weight change, cardiovascular and diabetes risk assessment using formal risk assessment tools/calculators or high-dose antipsychotic or polypharmacy with antipsychotics. Currently, guidance within the UK recommends the use of QRISK® to assess the risk of CVD in people with schizophrenia.55,66 Also lacking were studies involving pharmacy technicians in any patient facing roles.
A lack of data was found about the role/involvement of community pharmacy or pharmacy professionals other than pharmacists (i.e., pharmacy technicians) within primary care, follow up of individuals after implementation of a study intervention, utilisation of behaviour change, or self-management techniques community or family support.54
Also absent from the data was an in-depth exploration of the views, perceptions, or experiences of patients, (their) informal carers or caring dyads, pharmacy and care professionals where formal qualitative data synthesis had been undertaken. This is critical as it might inform the acceptability of service developments. Furthermore, such evidence would be central in establishing an agreed set of standards to assess and understand patients’ experiences of care in in facilitating and identifying those things that matter the most to patients. To address this specific gap, a PhD study was undertaken and completed in 2021.57
The PhD study reported many areas of unmet need. In particular, patients’ experiences of a lack of in depth, significant and meaningful interactions with pharmacists. Furthermore, patients have a desire for information exchange about CMR, MetS and related diseases as side effects of medication, rather than being informed and/or just simply being provided with a leaflet. A key step for pharmacy practice to impact on this is to increase pharmacist–patient facing interactions to facilitate the formation of long-lasting trusting relationships.
A starting point for this could be to build these practices into routine interactions, for example when a patient collects medication from the community pharmacy. In the long-term, increased frequency and depth of interactions can only be facilitated by appropriate resourcing of pharmacists to do this. Evidence from this study suggests that such a change will require not only increased numbers of pharmacists but also a change in working practices.
Changes in ways of working should incorporate the aspects of social, cultural, policy and healthcare organisational structures documented in this study. These challenges are created by medical hierarchies and the power dynamics and imbalances, labour divisions and boundaries of responsibility between care professions that compromise interdisciplinary working. Ultimately, this would encourage person-centred care with the aim of building trusting relationships, which is key in this vulnerable population.
Learning points
References
First published on our sister publication Hospital Pharmacy Europe
14th December 2022
HOPE Governors discuss their national Covid-19 programmes and delivery, and the consequences of the pandemic on somatic and mental healthcare provision to non-Covid patients.
Data were obtained from the OECD, Eurostat and WHO. When data were not available for one of the specific years, the closer year was used (denoted by *).
AUSTRIA

Different virus variants (and corresponding protection measures), especially seasonal ones, led to different stress situations and requirements in the hospitals. In 2020, the general measures included putting lockdown into effect, to prevent the spread of infection, and implementation of a test system. Protection measures were implemented in hospitals. Additional hospital capacities were created for these unknown and un-assessable hospitalisation needs.
The Ministry commissioned a study on the impact of the pandemic on inpatient care in Austria in 2020. The results showed that in the areas analysed there was – with the exception of stroke – a reduction in inpatient stays in the months of March to May 2020 and in November and December 2020 compared with previous years, although the reduction during the second lockdown was not as significant. Due to sufficient PPE, more testing possibilities and increased knowledge about Covid-19 gleaned during the first phase of the pandemic, the reduction was comparatively moderate considering the considerable number of hospitalised Covid-19 patients.
The vaccination programme commenced in 2021. The Delta variant brought with it an increased risk of infection with a similar severe course of disease and hospitalisation requirements as before. This was the first time for an increased capacity utilisation with intensive care capacities regionally exceeding the utilisation limit. In all federal states, elective surgeries had to be reduced to some extent to enable adequate capacity for Covid-19 patients in intensive care units.
By 2022, the Omicron variant changed some of the framework conditions. Compared with Delta, the Omicron variant is more infectious, but the course of the disease is milder (also due to vaccination) although the targeted level of vaccinations could not be achieved. Nevertheless, the high number of cases resulted in a high rate of hospitalisation. This again led to increased capacity utilisation, mainly regarding normal care capacities. At the same time, incapacity to work and segregation led to staff absence.
A seasonal additional demand for different resources has not yet been considered by structural planning in the health care system. In addition to the physical availability of beds, the utilisation of normal and/or intensive care units, as well as sick or separated health care staff, are limiting factors. In addition to regular monitoring activities, structural-, organisational- and personnel-related measures must be taken to ensure appropriate capacities in hospitals (e.g. beds, staff, equipment, protective gear). Flexible deployment of staff and flexible use of capacities are central to this. Framework conditions at federal and state levels are also important. The main objective is to cope with the (at least to some extent) seasonal increase in demand for Covid supplies care while largely maintaining standard care.
Also, mental health is a big focus, because depression, anxiety disorders and other mental health problems were aggravated or increased during the pandemic. An advisory group of experts in the Ministry of Health works on necessary measures, also addressing the mental health of children and juveniles and the subsequent issues arising in these populations. Various measures to improve the supply of specialists for psychiatry and psychotherapeutic medicine and for child and adolescent psychiatry are being examined, and thereby being able to offer patients easy and accessible comprehensive and multidisciplinary care.
To achieve the best possible coverage of demand, both specialties have already been classified as shortage subjects, and in the field of child and adolescent psychiatry, the training key was expanded by law at the beginning of 2022 to be able to train more physicians in this specialty. Additional quality assurances must be implemented to accompany such measures. Also, social paediatric facilities and child and adolescent psychiatric networks are included in comprehensive care considerations.
BELGIUM

In Belgium, 52% of the population have received the dose of the vaccine, producing a sharp decrease of infections during the past two months. There are only 1,000 people in hospital due to Covid-19 and 400 people in the ICU. The vaccination strategy is based on age and comorbidities and takes place mainly in vaccination centres. However, some hospitals are used for specialised vaccination, e.g. for oncology patients. The strategy challenges are mainly people not wanting to receive the vaccination and uncertainty. This varies among regions: vaccination willingness is high in Flanders and lower in Wallonia and Brussels.
During the two first waves of Covid, impact on care delivered to non-Covid patients was significant, notably given legal restrictions on hospitals. For 2020 and 2021, hospitals’ main activities decreased by 10-20%. Teleconsultation partially replaced in-person care. More than 30% of the Belgian adult population received care by phone and/or online, which is significantly lower than the OECD average.
Covid had a huge impact on mental health. Nearly 20% of the total population declare symptoms of depression – an increase of 100% compared with the pre-Covid period.
BULGARIA

Since the beginning of the pandemic, the total number of confirmed cases of coronavirus in Bulgaria is 1,253,934 (17.6% of the population), of which 1,207,195 (17% of the population) have been cured to date. Of these, the number of medics with proven coronavirus infection is 25,751 (38% of all). There are no data on the actual number of people who have become infected; it is assumed that the number is five-times more.
The number of deaths from Covid-19 as of 21 September 2022 was 37,694 (3% of confirmed cases and 0.53% of the population).
Currently, 1% of all available hospital beds, in a small number of hospitals, are engaged in the fight against the Covid pandemic.
The total number of doses of the Covid-19 vaccine administered was 4,540,537 (64% of the population). 2,071,300 people (29% of the population) were fully vaccinated.
As of 21 September 2022, 881,410 had received a booster dose, of which 72,704 had received a second booster.
Almost all hospitals have by now restored normal work practices and admission of patients.
However, the trend of increasing complicated medical cases in non-Covid patients due to untimely treatment or lack of treatment due to the pandemic continues. Cases of long-Covid are also increasing. Clinical pathways have been developed and are already being implemented for the rehabilitation of patients with long-Covid or with other complications due to a more severe Covid infection.
Research on the impact on the mental health of non-Covid patients has not been carried out in our country.
DENMARK

In Denmark, there has been a great willingness to get vaccinated. By August 2022, 84% of the population over the age of five years had received the first dose and 77% of the population over the age of 18 years had received second and third doses. Citizens over the age of five years were previously invited to receive the first, second and third dose – this former vaccination programme has now been phased out and replaced by a new programme. If citizens do not receive the first three doses, they are still recommended to have them.
Based on previous experience, it is expected that Covid-19 will be a seasonal disease – we also know that the risk of a severe Covid-19 infection is higher in older age. In Autumn 2022, the vaccine will first be offered to residents of nursing homes and citizens over 85 years of age. For this group, it was available from 15 September 2022. Following this, the vaccine was offered to citizens over 50 years of age from 1 October 2022. Employees from the healthcare sector who have close contact with patients and citizens who are in risk of severe Covid-19 will be offered a booster vaccine from 1 October 2022. The vaccines offered are variant-updated versions of Pfizer and Moderna vaccines.
Citizens will be offered the vaccine via digital post, whereafter it will be possible to book a timeslot for the vaccination. Citizens will be able to get vaccinated at public vaccination centres, private vaccination centres and some general practitioners.
The situation for other patients is, as in other EU countries, affected by delays. There is an agreement with the government to catch up on all the surgeries, but the work of reducing the delays is ongoing.
ESTONIA

The vaccination target in Estonia at the beginning of 2021 was for 70% of adults to be fully vaccinated by the start of autumn. We did not reach that goal by autumn 2021, but in autumn 2022, 75.8% of adults and 65.2 % of the whole population are vaccinated. The vaccination programme started with healthcare workers and older people in care homes, but since May 2021, vaccination has been available for everyone. Health care staff has been willing to being vaccinated, which has resulted in a positive outcome of decreasing numbers of infections in staff. The support of health care workers was confirmed with the signing of national collective agreement in 2021 where it was stated that vaccinated workers receive additional vacation bonuses while non-vaccinated workers do not. Our vaccination plans are currently being renewed by the government to consider new vaccines.
During different phases of the pandemic, there has been a need to postpone planned healthcare services for non-Covid patients. Medical departments and hospitals have been working overtime as much as possible to get these services back on track. But in doing so, the hospitals face difficulties not only with lack of staff but also with funding. There is a separate funding measure for Covid treatment in the Health Insurance Fund, and for 2023 there is also a separate budget planned to deal with the longer waiting times for planned care.
GERMANY

When immunisation of the public began, vaccination was organised primarily based on six priority groups in vaccination centres, and later also in medical practices and pharmacies. In addition to vulnerable patient groups, vaccination was offered as early as possible to hospital personnel as one of the priority groups. The demand from hospital employees was generally very high. Batches of the vaccine for the vaccination centres were delivered directly to hospitals to allow vaccination of personnel on site.
Institutionally-related mandatory vaccination has been in place Germany since 16 March 2022. This stipulates that those persons employed in hospitals that had not submitted proof of vaccination or recovery by 15 March 2022, and that are not subject to any medical contraindication for a Covid-19 vaccine, were to be reported by the hospitals to the competent public health authority. This measure was founded on the grounds of protection of patients from others in order to reduce transmission frequency by specialised staff and was to serve as the precursor for general mandatory vaccination of the public. The attempt to introduce mandatory vaccination for the public failed in April 2022. An important argument for rejecting general mandatory vaccination was that it would not necessarily prevent transmission. Against this backdrop, institutionally-related mandatory vaccination has also become the focus of attention of a politically controversial discussion.
A questionnaire undertaken by the German Hospital Institute in March 2022 shows that, on 23 March 2022, 94% of hospital employees were fully vaccinated or recovered. According to occupational groups, the average reporting rate in the nursing service (7%) was somewhat higher than for doctors (3%).
As of 2 September 2022, 77.9% of the public had received primary immunisation and 62% an additional booster vaccination; 8.7% have already received a second booster vaccination. There is no approved vaccine available for four million of the 18 million unvaccinated, partly due to age (predominantly children are affected) or intrapersonal factors, such as a disability or other pre-existing medical conditions and predispositions (e.g. rare coagulation disorders).
Beds in German hospitals were kept free to ensure sufficient capacity available for the care of coronavirus patients, and planned treatments were postponed. According to the Federal Statistical Office, it is to be assumed that, in addition to this, many people have also delayed essential hospitalisation, partly also in order not to overburden the healthcare system. The number of treatment cases and bed occupancy rate in 2021 remain under the pre-pandemic level. The number of treatment cases fell from 19.4 million in 2019 to 16.7 million in 2021. Bed occupancy decreased from 77.2% to 68.0%. As these changes have serious repercussions on the financing related to the German Radiological Society (DRG) of hospital services, the publicly led debate on financial relief measures from policy makers to secure patient care is ongoing.
LUXEMBOURG

The right to protection of one’s health is a right that every citizen can claim from the state as a subject of rights. The state is therefore obliged to manage its health system in such a way that situations leading to non-treatment or insufficient treatment are avoided.
Concerning the impact on the care of non-Covid patients, there have not been many issues so far, except for mental healthcare, but this is an established problem as there are not enough psychiatric centres. Covid-19 counselling centres have been closed and the general practitioners are the points of contact. There was also a two-way stream implemented in emergency services for Covid-19 patients and for non-Covid-19 patients.
Generally speaking, the number of hospitalisations remained stable and did not increase alarmingly, and the situation of the health system in the Grand Duchy of Luxembourg was not overloaded due to Covid-19 hospitalisations, both during the Delta and Omicron periods.
With uncertainties for the future, a group of experts convened by the government recommended the introduction of a partial vaccination obligation that applies to people over the age of 50 (residents). Partial vaccination is therefore intended to be risk-targeted and would concern only a fraction of the general population. The primary objectives are the maintenance of a fully functioning health system for Covid and non-Covid patients, the protection of the vulnerable and a normalisation of life for most citizens.
Some particular features of Luxembourg (a very open society, high mobility of the population, a very high number of cross-border workers) make it unfeasible to contain the circulation of the virus at the level of the whole society. Therefore, the main purpose of compulsory vaccination is to protect the health services, and in particular hospitals (intensive care and normal care), to ensure normal functioning.
Hospital beds and hospital staff workload are at the forefront of the debate on partial and sectoral vaccination. The acceptable burden on intensive care units, hospitals, society and the economy must be decided at the political level and ultimately by society as a whole. However, from the hospitals’ point of view, the critical level, which corresponds to 38 intensive care beds and 138 normal care beds occupied by Covid-19 patients, is declared when there is a need to cancel clinical interventions.
The age threshold proposed by the experts is 50 years because older age is associated with a risk of severe Covid complications and the risk factors and co-morbidities that predispose to severe Covid are also more frequent from the age of 50 onwards.
However, a sectoral vaccination requirement for the health and care sectors would only be recommended in the case of a highly virulent variant. Even then, vaccination should provide at least 50% protection against infection and transmission. All things considered; this is unlikely with current vaccines. Therefore, the majority of the expert group considers that a sectoral vaccination obligation cannot be recommended at this time.
It is therefore strongly recommended that the vaccination status – even independently of SARS-CoV-2 – should be subject to special regulations governing the responsibilities of persons working in the health and care sectors towards care recipients. This would include the obligation to disclose one’s vaccination status.
At present, only a draft law on compulsory vaccination has been timetabled with the proviso that it will only be finalised if the health situation worsens to such an extent that no other outcome is possible.
PORTUGAL

According to the Portuguese Central Administration of the Health System (ACSS) data, primary and hospital healthcare activity in the National Health Service (Serviço Nacional de Saúde – SNS) registered a significant recovery up to the end of February 2022.
In the first two months of 2022, 40.4% more surgeries were performed compared with 2021. The median waiting time on the surgical waiting list was 3.1 months at the end of February, which corresponds to a 24.8% reduction compared with 2021.
SNS hospitals carried out 15.6% more medical appointments compared to the same period in 2021, which is still in line with the values recorded in the same period of 2020 and 2019.
The data also indicate that emergency episodes recorded up to February, were above (55.2%) that of 2021 but still below (-19%) the pre-pandemic figures.
In primary healthcare there were around 5.3% fewer medical appointments than in 2021 but 10.4% more than in 2020. Of this total, 43.3% of medical appointments were face-to-face, which corresponds to a 38.4% increase over the same period in 2021.
SWEDEN

In Sweden, vaccination is always voluntary and the willingness to get vaccinated is generally high. By September 2022, 87% of all residents aged 12 and over had received at least one dose and 85% had received two doses of vaccine. A total of 67% of all residents aged 18 and over had even received a third dose. The rate of vaccination is higher among elderly people, as this age group has been given priority. In February 2022, elderly people were recommended to take a fourth dose, and by September 2022 approximately 76% of all residents aged 65 and over had received four doses. In August 2022, the Public Health Agency of Sweden recommended that everyone aged 65 and over, and persons aged 18 and over belonging to any of the risk groups, take a booster dose.
Statistics shows that the vaccination rate is much higher among healthcare staff compared with other persons of working age.
In Sweden, individual regions are responsible for vaccinations. Vaccination for Covid-19 has taken place in many different settings, often in temporary premises or drive-in centres, but also in primary care centres and hospitals.
The Covid-19 pandemic has had many different effects on the Swedish healthcare services. Before the pandemic, Sweden had a low number of ICU beds, but in the Spring of 2020, hospitals managed to quickly transform wards into ICUs, and transfer healthcare professionals from one part of the system to another. There was also a significant increase of digital services.
At the same time, there was initially less pressure on other parts of hospital services (cardiology, oncology) and less pressure on primary care. Planned treatment was postponed and waiting times were extended. Between March 2020 and January 2021, the total number of surgeries decreased by 22% compared to the same period in 2019/20. The number of planned surgeries decreased by 30%. The largest decreases in the total number of surgeries/interventions occurred in orthopaedics, general surgery and ophthalmology.
Although many people still fall ill with Covid, there are now (as of September 2022) significantly fewer people who need hospital care. Apart from a peak in the beginning of 2022 when the regions once again had to postpone planned treatments, the hospitals are trying to reduce the backlog for surgery from 2021. A problem then is the lack of qualified healthcare staff, such as specialist nurses.
UNITED KINGDOM

The UK has now vaccinated 45 million people (93.2% of the population aged 12+); 42 million had a second dose (87.2%), and 33 million had a booster dose (68.7%). A fourth dose was offered this Spring to people aged over 75, adult care home residents, and individuals aged 12 and over who are immunosuppressed.
In early 2022, it had been intended to mandate vaccination as a condition of deployment for healthcare workers. However, on 31 January 2022, amidst concerns about the impact on capacity, and views that the staff vaccination rate was high, the Government revoked this imminent requirement, and this policy remains. Local leaders continue to encourage vaccine uptake at a local level.
The UK has experienced three major Covid-19 waves in 2022 and anticipates a particularly significant one in autumn/winter 2022. This will likely occur alongside seasonal flu. As such, plans are underway for vaccination for both infections. The NHS recommends that Covid, flu, and pneumococcal vaccines should be promoted and given together wherever possible, especially where this might improve uptake. The autumn booster programme is expected to include all adults over age 65, care home residents and staff, clinically vulnerable adults aged 16-64, and frontline social care and health workers, to maintain their protection over the winter against severe Covid-19, reducing hospitalisation and death over this period.
In England, there are currently about 6.5 million people awaiting NHS care, as well as significant pressure on urgent and emergency care. Significant progress has been made, but the waiting list for physical and mental health care does continue to grow. Progress has focused on eliminating the 104+ week waiting list by July 2022 with good results. The aim to deliver around 30% more elective activity by 2024/25 than before the pandemic is intended to address backlogs, but there is a range of capacity challenges, including ongoing Covid-19 waves, staff sickness, staff vacancies, and patient flow issues.
Our summary of progress against recovery targets in England up to the end of June 2022 can be found via the NHS Confederation website.
Even before the Covid-19 crisis, European healthcare systems were facing numerous challenges: the long-term impacts of the financial and economic crises; the increasing demand of an ever-expanding ageing population; increasing numbers of chronic patients; increasing requests and availability of technological innovations; and new roles, new skills and new responsibilities for the health workforce.
The figures in this analysis provide the most up-to-date comparative picture of the situation of healthcare and hospitals and aim to provide an overview of the healthcare systems within the European Union member states before the pandemic. This edition will not only focus on hospital care but also on long-term care – a sector greatly impacted by the Covid-19 pandemic and often overlooked in healthcare but increasingly important with the rising elderly population. It will also cover ambulatory care.
Unfortunately, the data used for these two new additions are scarce, and the figures presented must be interpreted with caution, but at least they give a good indication of the pre-pandemic state of the healthcare systems.
The main source of data and figures is OECD Health Statistics (last updated July 2021). Data on health expenditure as percentage of total general government expenditure and on hospital beds in public or private owned hospitals have been extracted from the Eurostat Database on Health (last update July 2021).
All European Union member states belonging to OECD are considered, plus Switzerland, United Kingdom (UK) and Serbia (as HOPE has members in those countries), when data are available. In the text, these are reported as EU. When averages are reported, they result from our own calculation. The considered trends normally refer to the years 2016-19. When data in 2016 or 2019 are not available, or they have not been gathered for enough countries, the closest year is considered.
The current health expenditure per capita shows huge diversity in Europe (Chart 1). The amount of total current health expenditure per capita in 2019 was encompassed in the EU between 2074 PPP$ (purchasing power parity) in Latvia and 6518 PPP$ in Germany, with an average of 4153 PPP$. In Switzerland, this indicator even reached 7138 PPP. Since 2016, the total health expenditure per capita has varied positively in all the countries of this analysis. Major increases have been seen in Lithuania (30%), Czechia (28%) and Latvia (29%). Smaller increases were registered in Greece (4%) and Switzerland (5%).
Current public health expenditure includes all schemes aimed at ensuring access to basic health care for the whole society, a large part of it, or at least some vulnerable groups. Included are government schemes, compulsory contributory health insurance schemes, and compulsory medical savings account. Current private health expenditure includes voluntary health care payments schemes and household out-of-pocket payments. The first component includes all domestic pre-paid health care financing schemes under which the access to health services is at the discretion of private actors. The second component corresponds to direct payments for health care goods and services from the household primary income or savings: the payment is made by the user at the time of the purchase of goods or use of service.1
In 2019, the percentage of public sector health expenditure to the total current health expenditure was higher than 70% in most countries, except for Latvia (61%), Greece (60%), Portugal (61%), Hungary (68%), Lithuania (66%) and outside the EU, in Switzerland (67%). In Luxembourg, Sweden and Germany, it was above 85%. The private share ranged from 40% in Greece to 15% in Germany, Sweden and Luxembourg.
In the last years, health expenditure of the public sector accounted on average for 77% of total health expenditure.
In 2019, the percentage of government expenditure devoted to health in the total health expenditure ranged from 11% in Greece to 19% in Ireland.
The average trends illustrated in Chart 2 are generally positive between 2008 and 2019. In some countries such as Greece, expenditure decreased until 2015, when it started to increase again.
Out-of-pocket payments show the direct burden of medical costs that households bear at the time-of-service use.
In 2019, the household private contribution to healthcare spending in the EU accounted on average for 18% of total current health expenditure, a small decrease from the 20% in 2016.
In 2019, the private contribution to healthcare spending was around 18% in the EU, ranging from 9% in France to 37% in Latvia. The other lowest values were registered in Luxembourg (10%), the Netherlands (11%) and Slovenia (12%), while the other highest values were registered in Greece (35%) and Lithuania (32%). It is worth noting that Latvia, Lithuania, and Greece are among the countries with the lower current health expenditure on health in PPP$ that year.
Between 2016 and 2019 the household out-of-pocket payments in PPP$ per capita have increased in all the EU countries because of the increase in the demand of healthcare services and due to an increase in the total health expenditure. The exceptions were Switzerland (0%) and Luxembourg (-1%). The most relevant increases registered were in Estonia and Lithuania (30%). While the EU average was 11% increase.
Chart 3 illustrates the 2016-2019 trend of both the total current health expenditure per capita and the private households’ out-of-pocket payments on health. The chart highlights the fast growth of both expenses in the countries of the upper right part of the graph, such as Lithuania, Czechia, and Estonia. For those in the lower-left of the chart, the out-of-pocket payments grew more slowly compared with the total current health expenditure.
In most of the EU member states, 30-40% of current health expenditure (excluding investments and capital outlays) is devoted to hospital care.
More than 30-40% of current health expenditure finances hospital care, whereas 18-30% is devoted to ambulatory care and 4-24% funds long-term care, showing a continued hospital-centric health system in 2019.
In 2019, current hospital expenditure represented about 41% of total current health expenditure, ranging from 28% in Germany, to 45% in Greece and 44% in Estonia, Spain, Italy, and Denmark, respectively. In all countries, even if a part of the total health expenditure is always funded by private insurances and out-of-pocket payments, almost the entire amount of inpatient health expenditure is financed publicly. The total expenditure on inpatient care (PPP$ per capita) in the EU follows a growing trend.
Although reforms have tried to make systems emphasise primary care more, the data from 2019 still show major differences between countries. Ambulatory care is defined as establishments that are primarily engaged in providing health care services directly to outpatients who do not require inpatient services. This includes both offices of general medical practitioners and medical specialists and establishments specialising in the treatment of day-cases and in the delivery of home care services.
The EU average expenditure on ambulatory care is 25% of the total healthcare expenditure compared with 41% invested in hospitals. This situation is observed in most EU countries. The biggest differences between the two can be found in Greece (45% hospital, 19% ambulatory care), Spain (44% hospital, 22% ambulatory care), and Estonia and Italy (44% hospital, 23% ambulatory care). The smallest differences are in Luxembourg (33% hospital, 30% ambulatory care) and Belgium (38% hospital, 32% ambulatory care). The only EU country that spent more on ambulatory care than hospital care was Germany (28% hospital, 31% ambulatory care).
Furthermore, the lowest expenditure on ambulatory care is observed in the Netherlands (18%), Greece (19%) and Ireland (20%), whereas the highest was observed in Belgium (32%), Germany (31%) and Finland (31%).
Another increasingly important area of healthcare is long-term care. Owing to the increasingly ageing population in Europe and the significant impact of the pandemic, it is important to revise its state before Covid-19. The spending in long-term care is also extremely low compared with hospital expenditure. Long-term care (health and social) consists of a range of medical care, personal care and assistance services that are provided with the primary goal of alleviating pain and reducing or managing the deterioration in health status for people with a degree of long-term dependency.
The EU average is 10%, with the lowest expenditure found in Poland, Lithuania (1%), Greece (2%), Switzerland, Latvia, and Hungary (3%). The highest expenditure was in the Netherlands (28%), and Ireland (17%). The country with the smallest difference in expenditure between hospital care and long-term care was the Netherlands, whereas Poland and Greece had the biggest difference, as well as the smallest expenditure (Charts 4-6).
From 2016 to 2019, the amount of expenditure on hospitals from the total healthcare expenditure increased by an average of 14% in the EU; the biggest increases in expenditure took place in Latvia (31%), Czechia (24%) and Poland (22%). There were no decreases in any of the EU countries with available data showing an overall positive trend. Greece (4%), France (6%) and Switzerland (5%) had the smallest increases among the EU.
When comparing the variation of hospital expenditure with ambulatory care there is also a positive trend, with an average EU increase of 11%, except in Poland (-15%), Finland (-8%), Switzerland (-6%). The biggest increase was observed in Latvia (66%).
Long-term care expenditure also follows a positive trend with a 13% average increase in the EU and no decreases in any of the countries with available data. The biggest increases were observed in Estonia (106%), and the lowest in Sweden, Luxembourg (6%), Ireland (7%) and Switzerland (5%).
In recent years, healthcare reforms or other initiatives implemented all over Europe have aimed at rationalising the use and provision of hospital care, improving its quality and appropriateness, and reducing its costs.
The number of hospital facilities decreased in most countries while the number of hospital beds dropped off on average. These reforms and initiatives also resulted in a broad reduction of acute care admissions and length of stay, as well as in improvements in the occupancy rate of acute care beds.
This was made possible thanks to a package of financial and organisational measures addressed to improve coordination and integration between the different levels of care, increase the use of day hospital and day-surgery and introduce new and more efficient methodologies of hospital financing to incentivise appropriateness (e.g. the replacement of per diem payments – known to encourage longer hospitalisation – by prospective payment).
In most European countries, these policies led to changes in the management of patients within hospitals and offered the possibility to reduce the number of acute care hospital beds.
However, the bed-occupancy rates registered more disparate trends across Europe, depending also on the demographic and epidemiological structure of population and from the specific organisation of local, social and healthcare systems, i.e. the structure of primary care, the presence and the efficiency of a gate‐keeping system, the modality of access to secondary care, availability of home care and development of community care.
Between 2016 and 2019 the number of hospitals decreased in most of the countries, with the number of hospital beds decreasing to about 2%.
The total number of hospitals barely decreased in 2019 compared to a decrease ranging between 9% and 41% during 2006-16. Barely any changes happened in 2016-19 in Ireland, Estonia, Slovenia (0%) and Lithuania (+1%). The biggest decrease took place in Luxembourg (-17%) and the biggest increase in Poland (+16%) (Chart 7).
In the same period, few changes in the number of hospitals beds were registered in Slovenia, Switzerland, Slovakia, and Czechia (0%) The biggest increase was 3% in Portugal. Major decreases were registered in Finland (-15%), Sweden and the Netherlands (-8%) (Chart 8).
Moreover, there were on average 466 hospital beds for 100,000 inhabitants in the EU in 2019, ranging from 207 in Sweden to 791 in Germany (Chart 9).
Between 2008 and 2016, there was a decrease in the total number of beds which was in many countries accompanied by a slight increase in the number of private inpatient beds. The biggest increases during this time were in Romania (+560%) and Bulgaria (+154%). However, in 2019 there were few increases in private beds, with only some countries (such as Romania and Lithuania) showing an increase (28%). There was even a decrease in some countries. In 2019, countries with the highest percentage of private beds were Belgium (74%) and Germany (60%). Those with the lowest were Slovenia, Lithuania (1%) and Croatia (2%) (Chart 10).
The rate of acute care hospital beds for 100,000 inhabitants in 2019 in the EU ranged from 234 in Sweden to 791 in Germany. The other highest figures were in Austria (719) and Hungary (691) while the other lowest figures were in the UK (245), Denmark (259) and Ireland (288).
Between 2016 and 2019, the number of acute care hospital beds per 100,000 populations registered an average reduction by 4% in EU. The most significant decreases were in Finland (-16%), Sweden (-12%) and Luxembourg (-11%). The only exception was Portugal (4%), and Slovakia, Greece, Italy, and Denmark showed no significant changes (Chart 11).
Residential long-term care facilities are establishments primarily engaged in providing residential long-term care that combines nursing, supervisory or other types of care as required by the residents. In these establishments, a significant part of the production process and the care provided is a mix of health and social services, with the health services being largely at the level of nursing care, in combination with personal care services. They include long-term nursing care facilities and other residential long-term care facilities.
The number of long-term beds per 100,000 in habitants in 2019 in the EU was 768, ranging from 27 in Bulgaria to 1378 in the Netherlands. On average there was a 2% increase in the number of beds per 100,000 inhabitants from 2016 to 2019, with a few countries having a larger than average increase such as Serbia (+20%) and Austria (+12%). Although most countries show a positive increase a few had
a decrease in the number of beds per 100, 000 inhabitants: Croatia (-8%), Bulgaria (-11%) and Denmark (-17%).
To better understand the state of the healthcare system in the EU we also need to look at the number of primary healthcare units, however there is hardly any data available or from recent years. The countries with available data from 2000-2009 (most recent years available) are Bulgaria, Croatia, Czechia, Estonia, Hungary, Lithuania, Latvia, Finland, Portugal, Slovenia, Slovakia, Sweden, and Romania. They show minimal increases, with the biggest increase taking place in Latvia (from 116 to 121) and the biggest decrease in Croatia (from 79 to 73) (Chart 12).
The number of acute care discharges involves the entire pathway of hospitalisation of a patient, who usually stays in hospital for at least one night and then is discharged, returns home, is transferred to another facility, or dies. Curative care comprises health care contacts during which the principal intent is to relieve symptoms of illness or injury, to reduce the severity of an illness or injury, or to protect against exacerbation and/or complication of an illness or injury that could threaten life or normal function. Curative care includes all components of curative care of illness (including both physical and mental/psychiatric illnesses) or treatment of injury, diagnostic, therapeutic and surgical procedures, and obstetric services. It excludes rehabilitative care, long-term care, and palliative care.
The average length of stay measures the total number of occupied hospital bed-days, divided by the total number of discharges. In 2019, the average length of stay in acute care hospitals ranged from 10 bed-days in Hungary and in Czechia to 6 bed-days in Sweden, Ireland, and Belgium.
In 2019, the rates of inpatient discharges in the European countries were quite dissimilar, ranging from 25 discharges per 100 in Germany to 11 discharges per 100 in Italy.
The average length of stay is around eight days in the EU.
The link between the rate of admissions and the length of stay can be a very sensitive issue for hospitals, as it is commonly acknowledged that too short a length of stay might increase the risk of re-admissions, with a consequent waste of resources both for the hospital and for the patients and their careers. At the same time, staying too long in a hospital might indicate inappropriate settlements of patients, also causing a waste of resources.
Chart 13 compares the rate of hospital discharges and the average length of stay for acute care hospitals in 2019. The last updated data show that the average European figures corresponds to a mean rate of discharges by 17% and a mean length of stay of 8 days for acute care hospitals. Chart 13 shows that both indicators are higher than the EU average in France, Latvia, Czechia, Hungary, Austria, and Germany.
The bed occupancy rate represents the average number of days when hospital beds are occupied during the whole year and generally mirrors how intensively hospital capacity is used.
In 2019, the average acute care occupancy rate in Europe was equal to 75%, but the gap between the highest and the lowest rate was 16 percentage points.
Between 2008 and 2019, the average rate of acute bed occupancy decreased in Europe. The biggest reductions were in Hungary (-4,7), Slovakia (-3,20) and Czechia (-3,20). A particularly big increase was observed in Luxembourg (6,90). These large variations are usually due to changes in the number of admissions, average length of stay and the extent to which alternatives to full hospitalisation have been developed in each country (Chart 14).
Despite the growing interest in self-treatment and the growing role of digital health, especially during the pandemic, health workers remain the crucial component of health systems, providing health services to the population. Despite health workers numbers tending to grow in the last 15 years, policy makers are raising issues about the upcoming retirement of the ‘baby-boom’ generation of doctors and nurses, exacerbating the workforce shortage in the health field. Health workforce concerns shifted from worries on shortages towards issues related to the right skill-mix, to better respond to evolving population health needs. The financial constraints, are leading in most European countries to a decrease in the resources available for healthcare professionals, reducing the possibilities of hiring new staff. Additionally, several countries, especially in central and Eastern Europe, are experiencing migrations of their healthcare workforce.
European countries, European organisations and EU institutions are discussing possible impacts and achievable solutions to these issues. Interestingly, several countries are shifting competences from doctors to nurses, creating new educational pathways and bachelors’ degrees addressed to nurses.
In many cases, nurses and general practitioners acquire new skills and competences, relieving the burden of hospital care by enforcing primary care institutions and community services (Chart 15).
The trends described above are likely to have major impacts on the hospital sector, since inpatient care alone absorbs about a third of the healthcare resources and because the hospital sector gives work to more than half of active physicians.
An overview of the composition of the European healthcare workforce in 2019 shows an average rate of about 2.5 nurses per physician.
In 2019, the share of practising nurses per 100,000 inhabitants was lowest in Greece (338), Latvia (439), Poland (510) and Spain (589) (Chart 16). The highest values belong to Germany (1395), Belgium (1107), Sweden (1085) and Switzerland (1796). For the same year, the lowest share of practising physicians was registered in Poland (238), the UK (295), Belgium (316) and France (317) whereas the highest values were in Austria (532), Lithuania (457) and Germany (439) (Chart 17).
These figures provide evidence the trends for the management of healthcare professionals, especially concerning the allocation of resources and responsibilities between physicians and nurses. The average rate of nurses per physicians is about 2.4 points in the EU. In 2019, the highest values were in Germany (5.4), Luxembourg (4.0), Belgium (3.5) and Switzerland (4.0). In these countries, there is a high shift of competencies from physicians to nurses. Conversely, in countries where the values are lowest – such as Lithuania (1.7), Latvia (1.4), Spain (1.4) and Italy (1.4) – physicians continue to perform most of the clinical activities.
In 2019, according to available data, physicians working in hospital (full or part time) were around over 50% of the total, with the EU average reaching 67%
The highest rates registered are in Belgium (209%), France (83%) and Switzerland (77%). On the other side, the lowest values are the Netherlands (36%), Latvia (45%), Spain (54%), Ireland and Austria (55%).
The long-term workforce can be categorised as formal and informal; as there are few data available for informal workers, this focuses on the formal workers exclusively. These include nurses and personal care workers. Moreover, we will focus on long-term workers working with the 65 years old and over population.
Data for long-term care formal workers per 100,000 population aged 65 years old and over in 2016–2019 were only available in a few countries; Portugal; Spain; Germany; Switzerland; Austria; Netherlands; Estonia, Denmark; Sweden; Luxembourg; Slovakia; Ireland; and Hungary. In 2019, Sweden had the highest number of formal workers per 100,000 population aged 65 years old and over (11,900), while the lowest was found in Portugal (800). From 2016 to 2019, Portugal (+14%), Spain (+7%), Germany (+6%), Switzerland and Austria (+2%) had an increase in the number long-term care formal workers per 100,000 population aged 65 years old and over, whereas Estonia (-2%), Denmark (-3%), Sweden (-4%), Luxembourg (-5%), Slovakia, Ireland (-7%), and Hungary (-14%) had a decrease in the number for workers. There was no significant change in the Netherlands.
Long-term workforce is also categorised as those working in institutions and those working at patients’ homes. Long-term care at home is provided to people with functional restrictions who mainly reside at their own home. It also applies to the use of institutions on a temporary basis to support continued living at home – such as in community care and day care centres and respite care. Home care also includes specially designed or adapted living arrangements (for instance, sheltered house) for persons who require help on a regular basis while guaranteeing a high degree of autonomy and self-control, and supportive living arrangements. Long-term care institutions herein refer to nursing and residential care facilities which provide accommodation and long-term care as a package. They refer to specially designed institutions or hospital-like settings where the predominant service component is long-term care, and the services are provided for people with moderate to severe functional restrictions.
For this, data are only available for a handful of countries: Estonia, Denmark, Hungary, Germany, Netherlands, Luxembourg, Austria, Portugal, and Switzerland. In countries where data are available, there is a higher percentage of workers working in institutions than at patients’ homes. The percentage of long-term care workers working at an institution varied from 83% in Portugal to 21% in Estonia, while for those at home, it ranged from 79% in Estonia to 17% in Portugal.
In 2019, the average number of physicians and nurses graduated for every 100,000 inhabitants were, respectively, about 15 and 41 in the EU. However, the values across countries were quite different. The number of medical graduates per 100,000 inhabitants ranged from 10 in France and Estonia to 24 and 25 in Latvia and Ireland, respectively. The number of nurses graduated per 100,000 inhabitants ranged from 11 and 18 in Luxembourg and Italy to 82 and 108 in Finland and Switzerland.
Compared to 2016, the number of medical graduates per 100,000 inhabitants in the EU registered an overall positive variation (Chart 18). The countries that registered the highest increases were Latvia (+44%), Italy (+33%), Lithuania (+27%), Greece and Belgium (+23%). Minor positive variations were seen in Switzerland, Sweden (+12%), and Hungary (+11%), where as there were decreases in Slovenia (-12%), Estonia (-6%), Portugal (-4%), the Netherlands and Finland (-1%).
The number of nurses graduated per 100,000 inhabitants showed different trends across the EU (Chart 19). Major positive variations were registered in Czechia (81%), the Netherlands (35%), Latvia (34%) and Poland (33%), whereas minor positive variations were registered in Denmark (2%), and Portugal (8%). The most relevant decreases were registered in Belgium (-44%) and Slovakia (-27%).
Reference
5th September 2022
Roberta di Blasi MD PhD is a haematologist at Saint Louis Hospital in Paris where she is a specialist in CAR-T cell therapy for lymphoma. Hospital Healthcare Europe had the pleasure of hearing her thoughts and perceptions on CAR-T therapy and its role in treating patients with lymphomas.
Prior to her appointment in Paris, Dr Roberta di Blasi completed her residency in haematology at the Catholic University School of Medicine, Policlinico Universitario Agostino Gemelli in Rome. Towards the end of her residency, she moved to Paris, initially working at CHU Henri Mondor in Créteil, where she became involved in bone marrow transplantation and acute leukaemias and developed a special interest in infections among haematology hosts. In 2018, she moved to Saint Louis to take part in the CAR-T cell project.
Saint Louis is a large, specialist haematology hospital with seven wards dealing with different haematological malignancies. Dr di Blasi is part of a team of seven clinicians, of whom two are based in the outpatient or day-care centre, caring for patients with lymphoma and chronic lymphocytic leukaemia. The unit has 16 beds and treats patients with chemotherapy and CAR-T cell therapy. It is a busy department, which, according to Dr di Blasi, took care of 661 patients, including 450 new patients, in 2021.
Dr di Blasi described how CAR-T therapy is ‘a form of immune therapy that makes use of the patient’s own T lymphocytes that are engineered to express an antigen that can recognise a target in the tumour cell.’ Although this target can vary depending on the pathology, she explained that ‘with lymphomas, our target is CD19, which is expressed on the cell surface of lymphomas.
Consequently, the T cells are modified to express a receptor that can recognise the CD19 on tumour cells, link to the tumour cell, and ultimately destroy it.’ Dr di Blasi explained how CAR-T therapy is a relatively new approach to the treatment of lymphomas, but while it was only introduced into clinical practice in Europe in 2018, the technology had been investigated in clinical trials for a much longer period of time prior to this.
Dr di Blasi said that her own interest in CAR-T cell therapy began in 2017 when clinicians at the hospital became more attracted to the technology, especially for patients with refractory malignancies. Given her prior experience and knowledge of allogenic bone marrow transplantation, she believed it was a natural fit, particularly as there are some complications that can arise from CAR-T cell therapy that bear similarities to those experienced by patients undergoing allogeneic bone marrow transplants. And she remains fascinated by the technology to this day.
Although her department does have strong links to the pharmaceutical industry and participates in clinical trials, an equally important part of its work involves the examination of the findings held in a national patient registry. The registry (termed DESCAR-T) collates data from patients across France and enables a much greater understanding of the impact of real-world experience of CAR-T cell therapy.
In addition, other areas of research within the hospital include basic biological science and translational research, which are designed to better understand CAR-T.
Although diffuse large cell B lymphomas and the family of related lymphomas are treated with CAR-T cell therapy, Dr di Blasi pointed out that ‘recently, the centre had received authorisation to treat mantle-cell lymphoma and follicular lymphoma’.
Dr di Blasi felt that the patient registry outcome data, in particular, treatment efficacy seen in real-world data derived from registry data, are comparable to that observed in the clinical trials, adding that the extent of toxicities was probably lower with the registry data, which was likely a reflection of how clinicians were better able to manage these adverse effects in practice.
Nevertheless, she stressed that because the production of products differed, it was not always easy to compare the effectiveness seen in the trials with the registry data although, broadly speaking, the two datasets provided similar results.
Although a novel and promising therapeutic approach, Dr di Blasi explained that CAR-T is not currently a first-line treatment option and that her hospital is only authorised to use the therapy third-line after two unsuccessful chemotherapy regimens.
She mentioned how the department currently uses two CAR-T cell products aggressive B cell lymphoma or transformed follicular lymphoma. Despite the constraint of having to use CAR-T cell therapy third-line, this might change over time, and she noted that clinical trials are starting to report on the value of CAR-T cell therapy as a second-line option in either refractory patients or in those who relapse within the first year of chemotherapy.
She also added that ‘axi-cel CAR-T cell therapy will hopefully be used as a second-line treatment for patients with lymphomas who relapse within the first year of treatment as well as refractory patients and hopefully, by the end of the year, axi-cel will be available for follicular lymphoma too.’ She revealed how the department is likewise eagerly ‘waiting for liso-cel (another CAR-T cell product) to be available for large-cell B lymphoma as well as some other entities, such as transformed marginal zone lymphoma, that were not covered by the older CAR-T cell products.’
Although CAR-T cell therapy makes use of a patient’s own cells, Dr di Blasi explained that because the cells undergo modification, it is designated a ‘product’ and therefore subject to all the standard regulatory approvals required for drugs.
Dr di Blasi explained that in her department, after a single infusion, patients were monitored for the first 10 days and, if there are no problems, discharged home but contacted daily until day 21. After 28-30 days, patients revisit the centre for efficacy assessment by a clinician.
Following this, patients are reviewed after three months, as any relapse is likely to occur at this point, and then every 90 days. She described how there were no specific criteria for choosing CAR-T cell products and this relied solely on the availability of the manufacturer to produce the product.
In cases where CAR-T cell therapy was ineffective, patients would not be switched to an alternative CAR-T cell product because, as Dr di Blasi clarified, ‘one route of escaping the treatment – that is, therapeutic failure – is due to loss of the antigen and because the target is the same, there is little point in switching to another CAR-T product.’
Dr de Blasi outlined how she has seen some remarkable results for CAR-T cell therapy, noting how ‘we have seen response rates in real life of 40-60% and are comparable to those seen in the clinical trials.’
Dr di Blasi described how after a few years of clinical experience with CAR-T cell therapy, clinicians are now better able to identify specific risk factors, both clinical and biological, such as high tumour burden, that negatively affect the response to CAR-T cell therapy. Using this knowledge, she thinks that ‘for some patients, it might be logical to conceive CAR-T cell therapy earlier in the therapeutic line.’
She mentioned that the ZUMA-12 trial has produced some remarkable findings. This is a Phase II, multicentre, single-arm study evaluating axicabtagene ciloleucel as part of first-line treatment in patients with high-risk large B-cell lymphoma or with an insufficient response after two courses.
As a result, she thinks that ‘the therapeutic strategy might change according to the clinical features at diagnosis for the patients’. However, she felt that in practice, third-line CAR-T therapy would be best suited to those patients with limited disease who are likely to respond well to the treatment.
One important and limiting factor to the greater use of CAR-T cell therapy is cost. Currently, Dr di Blasi said, ‘the total hospitalisation costs for one patient receiving CAR-T therapy is approximately €480,000’. Despite this, she pointed out that health economic studies have been favourable for CAR-T cell therapy, especially if the patient goes into remission and that, currently, ‘the balance is still in favour of CAR-T cell use’.
A further limitation to wider use was that ‘not all centres are fully certified to administer CAR-T cells’, with currently only around 31 centres being able to provide the treatment in France. An important part of the CAR-T programme, therefore, is education and involved visiting and discussing the specific patient referral criteria with non-accredited sites.
Dr di Blasi described how ‘the two well-known side-effects of CAR-T therapy – at least the ones that we have been concentrating on – are cytokine release syndrome and neurotoxicity syndromes, and these can vary substantially depending on the pathology being treated, the CAR-T cell product and even the different clinical trials.’
With the severity of these adverse effects graded on a scale from 1 to 5, Dr di Blasi mentioned that ‘grade 3 or higher [adverse effects] can vary from 8-10% and up to roughly 30% for axi-cel and from 2% to 20% for tisa-cel. Liso-cel, for which there is currently less real-world data, also has a favourable toxicity profile’.
Nevertheless, with greater clinical experience in using CAR-T cell therapy comes a better understanding of how best to manage these adverse effects. Despite advances in the management of the two key side-effects, Dr di Blasi feels that a better understanding of other emerging adverse effects was still required.
This included cytopaenia, for example, which might affect up to 10% of patients after one year, as well as the risk of infection and hypo-gammaglobulinaemia. Finally, she revealed how there is an ongoing continuing debate over whether autologous stem cell transplantation after second-line chemotherapy is more toxic than CAR-T cell therapy.
Furthermore, Dr di Blasi explained that the decision over whether to use CAR-T cell therapy for a patient was complex and involved a consideration of many different factors, but the existence of treatment algorithms had been of great value to clinicians.
Dr di Blasi thinks that immunotherapy would be the next step in the management of patients who fail to respond to CAR-T cell therapy and does not believe that such patients would benefit from further chemotherapy, a point already proven in trials. She added that in some tumours, if a second surface antigen – CD20 – is still expressed, then immunotherapy can help.
First and foremost, over the next five years, Dr di Blasi hopes to see patients with the longest possible remission and with no, or very few, long-term side effects. Future developments might enable a reduction in the level of side effects through alteration of the receptor on the CAR-T cells.
As she explained, ‘we know that toxicities are partially linked to the structure of the receptor on the surface of the CAR-T cells and to the expansion profile, so modification of this structure might lead to less toxicity, and we already have three available products which have different toxicity profiles’.
While modifying the receptor might be possible, this approach is not guaranteed to lessen the incidence of adverse effects as there are many other factors that can affect an individual’s risk of adverse effects, including the number of T cells infused and the microenvironment of the patient’s tumour, both before and after infusion, and such effects are not always predictable. In addition, she added that much more work is needed to understand why some, but not all, patients are prone to cytopaenia.
Although CAR-T cell therapy targets a particular antigen, Dr di Blasi thinks that it is theoretically possible to deploy the technology in the treatment of any form of cancer, including solid tumours, provided that a discriminatory antigen can be found, and this is an area of ongoing research. One possible therapeutic area she would like to see CAR-T cell therapy used is in the treatment of T-cell lymphomas.
Dr di Blasi concluded that CAR-T cell therapy has been a major advance in the treatment of lymphomas, but there was still much to learn, not just about the technology itself, but also about how it affects patients and what might be achieved in the coming years to maximise the benefits and minimise the adverse effects the patients in her care.
IMPORTANT LINKS
MORE FROM COGORA
© Cogora 2025
Cogora Limited. 1 Giltspur Street, London EC1A 9DD
Registered in the United Kingdom. Reg. No. 2147432