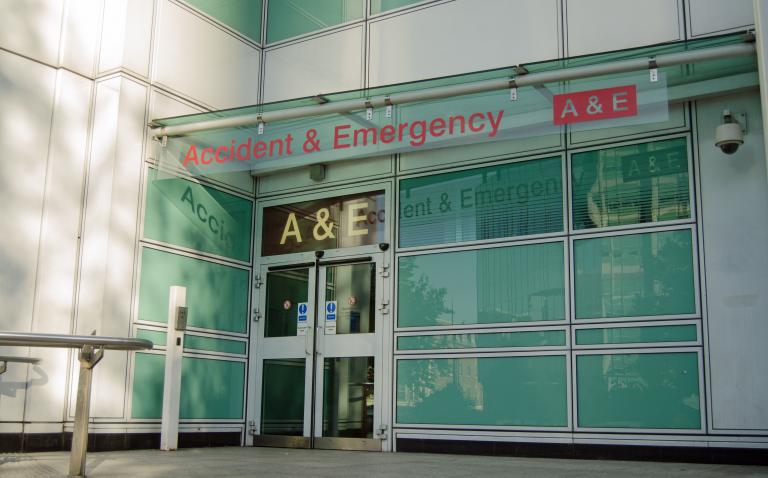
There were more than twice as many attendances to Accident and Emergency departments in England for the 10% of the population living in the most deprived areas (3.1 million), compared with the least deprived 10% (1.5 million) in 2018-19.
NHS Digital’s Hospital Accident and Emergency Activity 2018/19, created in partnership with NHS England and NHS Improvement, also shows that attendances for the 20% of the population living in the most deprived areas accounted for 27% of all A&E attendances (5.9 million attendances).
The report brings together newly published data from NHS Digital’s Hospital Episode Statistics (HES) with previously published data from NHS England and NHS Improvement’s A&E Attendances and Emergency Admissions Monthly Situation Reports (MSitAE). It includes attendances from all types of Accident and Emergency departments ranging from major A&E departments, single specialty, consultant-led emergency departments to Minor Injury Units and Walk-in Centres.
HES data in the report shows for 2018/19:
- Monday is the busiest day of the week and the most popular time of arrival is between 10am and 12pm
- The number of reattendances to A&E within 7 days was 1.9 million and accounted for 8.7% of all reported attendances
- Patients arriving from 8am to 10am generally spent the shortest time in A&E with 16% of patients arriving between 8am and 8:59am spending one hour or less; and 90% of arrivals between 9am and 9:59am spending four hours or less
- Looking at all arrival times, 1.5% (330,000) of all attendances in 2018/19 spent more than 12 hours in A&E, compared with 1.6% (333,000) in 2017/18. This measures the entire duration of stay in A&E.
MSitAE data in the report shows that:
- There was a 4% increase in attendances to A&E during 2018-19 (24.8 million), compared to 2017-18 (23.8 million) and a 21% increase since 2009-10 (20.5 million)
- The average growth per year over the period since 2009-10 is 2%, compared with the England population average growth of 1% per year, over a similar period


