


The figures given in the present document provide the most updated comparative picture of the situation of healthcare and hospitals, compared to the situation in 2006
For several years, hospitals have been required to act more efficiently and to increase productivity. Increased performance is indeed visible. Yet, healthcare systems are facing conflicting trends: short and long-term impacts of financial and economic restrictions; increasing demand of an ever-expanding and ageing population, which leads to more chronic patients; increasing requests and availability of technological innovations; and new roles, new skills and new responsibilities for the health workforce.
To adapt to this situation, the role of hospitals is evolving further. Most health systems have already moved from a traditional hospital-centric and doctor-centric pattern of care to integrated models in which hospitals work closely with primary care, community care and home-care.
The figures given in this article provide the most up-to-date comparative picture of the situation of healthcare and hospitals, compared with the situation in 2006. The figures aim to increase awareness on what has changed in hospital capacity and, more generally, in secondary care provision within European Union member states, generating questions and stimulating debate, and in this way fostering information exchange and knowledge sharing.
The main source of data and figures is OECD Health Statistics (last update November 2018). Data on health expenditure as a percentage of total general government expenditure and on hospital beds in public or private owned hospitals have been extracted from the Eurostat Database on Economy and Finance (last update March 2019) and on Health (last update July 2018), respectively. All European Union member states belonging to OECD are considered, plus Switzerland and Serbia (as HOPE has observer members in these countries), when data are available. In the text, these are reported as EU. Whenever considered appropriate and/or possible, two groups have been differentiated and compared: EU15, for the countries that joined the EU before 2004 (Austria, Belgium, Denmark, Finland, France, Germany, Greece, Ireland, Italy, Luxembourg, Netherlands, Portugal, Spain, Sweden and United Kingdom) and EU13, for the countries that joined the EU after 2004 (Bulgaria, Cyprus, Czech Republic, Croatia, Estonia, Hungary, Latvia, Lithuania, Malta, Poland, Romania, Slovakia and Slovenia). When averages are reported, they result from our own calculations. The considered trends normally refer to the years 2006–2016. When data on 2016 are not available, or they have not been gathered for a sufficient number of countries, the closest year is considered. Some figures are disputed for not being precise enough but at least they give a good indication of the diversity.
Financial resources for healthcare
From 2006 to 2016, about 50% of the total current health expenditure expressed in purchasing power parity (PPP$) per capita increased on average in the EU. Inpatient care, out-of-pocket payments and pharmaceutical expenditures grew in the considered years as well.
In EU15, the range of total current health expenditure per capita in 2017 was between 2325 PPP$ in Greece and 6475 PPP$ in Luxembourg, whereas in EU13, this range varied from 1722 PPP$ in Latvia to 2775 PPP$ in Slovenia. In Switzerland, this indicator reached 8009 PPP$. Compared with 2006, the total health expenditure per capita in 2016 varied positively in all the countries taken into consideration in this analysis, except in Greece, where the decrease was –12%. Major increases have been registered in EU13: Estonia (+110%), Lithuania (+107%) and Poland (+103%). Smaller increases were registered in Spain (+36%), Italy (+25%) and Portugal (+24%), all belonging to EU15.
Current public health expenditure includes all schemes aimed at ensuring access to basic health care for the whole society, a large part of it, or at least some vulnerable groups. Included are government schemes, compulsory contributory health insurance schemes, and compulsory medical savings accounts. Current private health expenditure includes voluntary health care payments schemes and household out-of-pocket payments. The first component includes all domestic pre-paid health care financing schemes under which the access to health services is at the discretion of private individuals. The second component corresponds to direct payments for health care goods and services from the household primary income or savings: the payment is made by the user at the time of the purchase of goods or use of service.
In 2017, the percentage of public sector health expenditure to the total current health expenditure was higher than 70% in most countries, except for Latvia (55%), Greece (61%), Portugal (67%), Hungary (67%), Lithuania (67%) and Poland (69%) and, outside the EU, in Switzerland (63%).
In the last years, public sector health expenditure accounted on average for 74% of total health expenditure and 15% of the total government expenditure.
Between 2006 and 2016, the public health expenditure in PPP$ per capita increased on average to almost +50% in the EU. The countries that registered the most significant increases are Lithuania (+105%), Poland (+105%) and Estonia (+117%), whereas those that registered a minor increase were Luxembourg (+15%), Portugal (+19%) and Italy (+20%). Greece was the only country where this indicator decreased (–15%) (Chart 1).
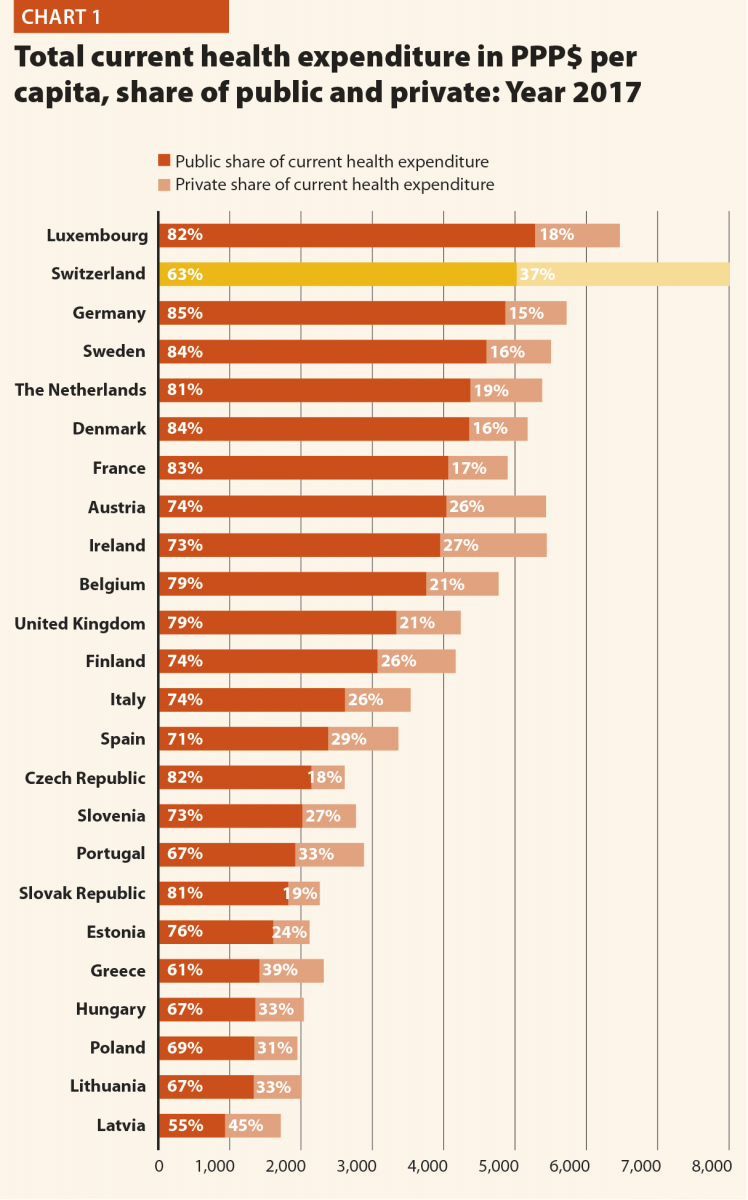
Chart 2 shows the trend over the past ten years concerning the share of government expenditure in health. It presents the aggregated data concerning the EU, and the figures of the three countries having the highest and the lowest values in the year 2017, Switzerland included.
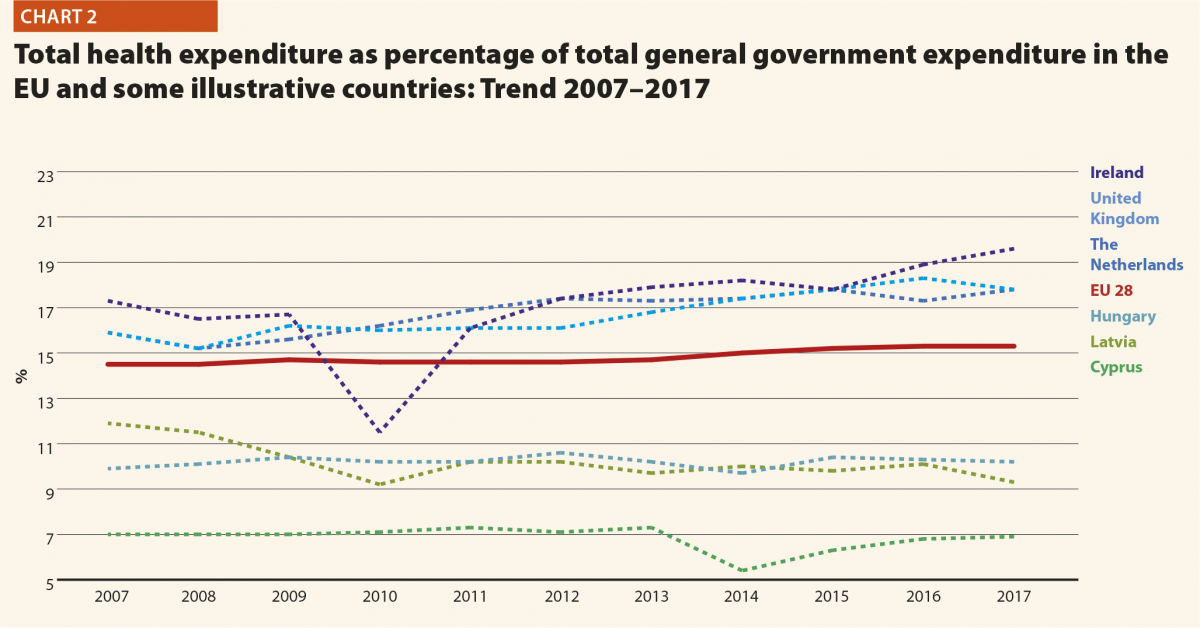
In 2017, the percentage of government expenditure devoted to health on total health expenditure ranged from 7% in Cyprus to 20% in Ireland. In Switzerland, this indicator was 6.4%.
The trends illustrated in Chart 2 are generally positive between 2007 and 2017 with an average yearly increase of percentage of government outlays devoted to health by 0.08 p.p. Yet, from 2009 to 2010, this way of development slackened off in many countries, the reasons including the effects of the financial crisis or the shift of interest and priorities to other sectors.
Out-of-pocket payments show the direct burden of medical costs that households bear at the time of service use. Out-of-pocket payments play an important role in every health care system.
In 2016, the private contribution to healthcare spending was around 20% in the EU, ranging from 10% in France to 45% in Latvia. The other lowest values were registered in Luxembourg (11%), the Netherlands (11%) and Slovenia (12%), while the other highest values were registered in Hungary (30%), Lithuania (32%) and Greece (30%). It is worth noting that Latvia, Hungary, Lithuania and Greece are among the countries with the lowest current health expenditure on health in PPP$ that year.
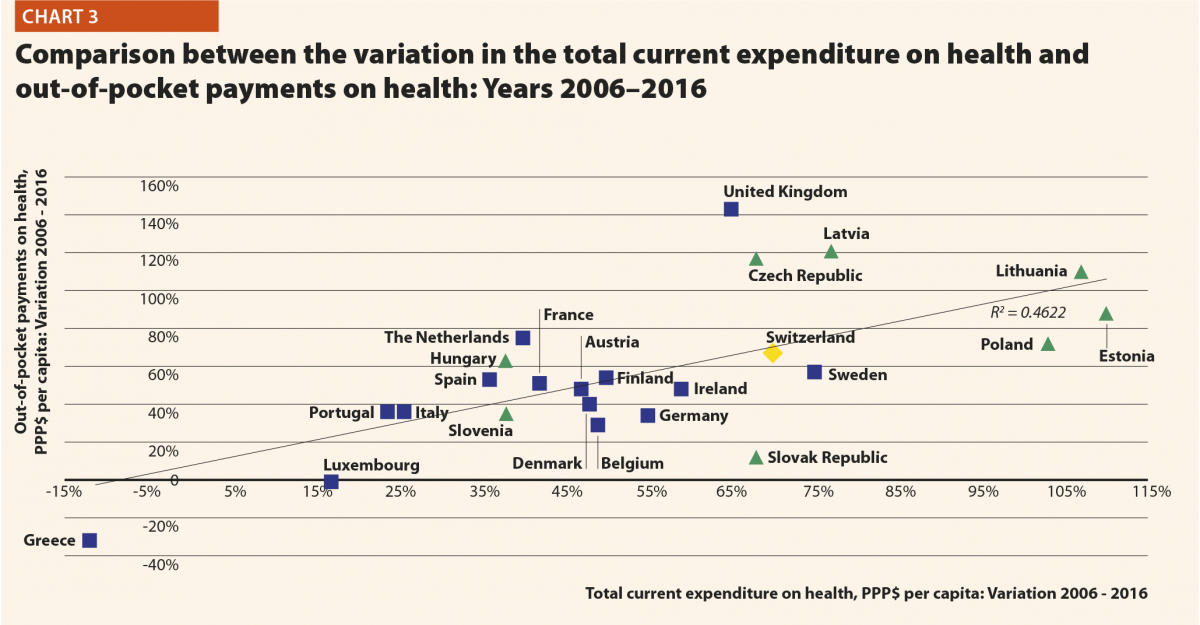
Between 2006 and 2016, the household out-of-pocket payments in PPP$ per capita has increased in all the EU countries, except for Greece (–32%) and Luxembourg (–1%). The most relevant increases in EU15 were in the United Kingdom (+143%) and the Netherlands (+75%). In Switzerland, the indicator varied by +67% in the years taken into consideration. In EU13, according to available data, the abovementioned figure registered highest increases in Latvia (+121%), Czech Republic (117%) and Lithuania (+110%). The total household out-of-pocket payments in PPP$ per capita continued to increase, because the demand of healthcare services and, in turn, the total health expenditure did.
Chart 3 illustrates the trend 2006–2016 of both the total current health expenditure per capita and the private households’ out-of-pocket payments on health. These values present a correlation (R² = 0.4622) showing that there is dependence between the two indicators. The chart highlights the fast growth of both expenses in the countries located in the upper right part of the graph corresponding to countries belonging to EU13. In those in the lowest-left section of the graph, the out-of-pocket payments grew more slowly compared with the total current health expenditure.
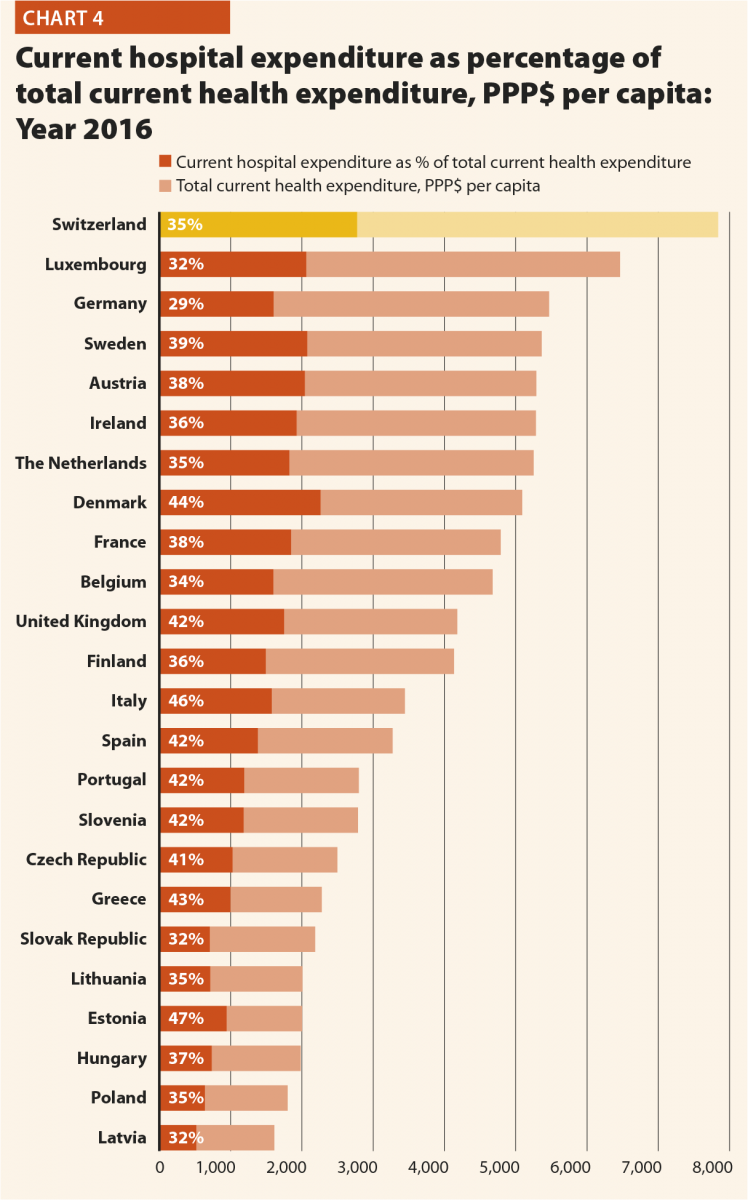
In the majority of the EU member states, 30–40% of current health expenditure (excluding investments and capital outlays) finances hospital care. The funds allocated to providers of long-term care, ancillary services, ambulatory care, preventive care as well as to retailers and other providers of medical goods are excluded from this computation.
In 2016, current hospital expenditure represented approximately 38% of total current health expenditure, ranging from 29% and 32% in Germany and Latvia, respectively, to 46% and 47% in Italy and Estonia (Chart 4). In all countries, even if part of the total health expenditure is always funded by private insurance and out-of-pocket payments, almost the entire amount of inpatient health expenditure is financed publicly. The total expenditure on inpatient care (PPP$ per capita) in the EU follows, on average, a growing positive trend. The exception is Greece, where data available show that this indicator varies negatively (–19%).
Pharmaceutical expenditure includes the consumption of prescribed medicines, over-the-counter and other medical non-durable goods. One of the indicators taken into consideration for 2016 was the expenditure on pharmaceuticals and other medical non-durable goods, as percentage of current health expenditure. The countries that registered the lowest rates of this indicator are Denmark (7%), The Netherlands (8%), Luxembourg (9%) and Sweden (10%) whereas the highest ones were Greece (26%), Lithuania (27%), Latvia (28%) and Hungary (29%).
Between 2006 and 2016, the percentage of pharmaceutical expenditure on total current health expenditure has generally declined in all of Europe. In 2016, the total pharmaceutical expenditure was encompassed between 335 PPP$ and 369 PPP$ per capita in Denmark and Poland respectively, and 777 PPP$ and 1080 PPP$ per capita in Germany and Switzerland. At least half of it was held by the public sector in all countries except Denmark (44%), Latvia (35%) and Poland (34%) and Lithuania (33%). The highest values in 2016 were in Germany (84%), Luxembourg (80%), Ireland (77%), France (76%) and Slovakia (71%). In 2016 the pharmaceutical expenditure in PPP$ per capita held by the public sector was encompassed between 124 in Poland and 655 in Germany.
Chart 5 explores the relationship between the trend of the total and the public pharmaceutical expenditure between 2006 and 2016. In a group of outlier countries (upper right part of the chart) encompassing Estonia, Latvia and Lithuania, both the public and the total spending varies substantially. In Portugal, Luxembourg and Greece, the same indicators varied negatively.
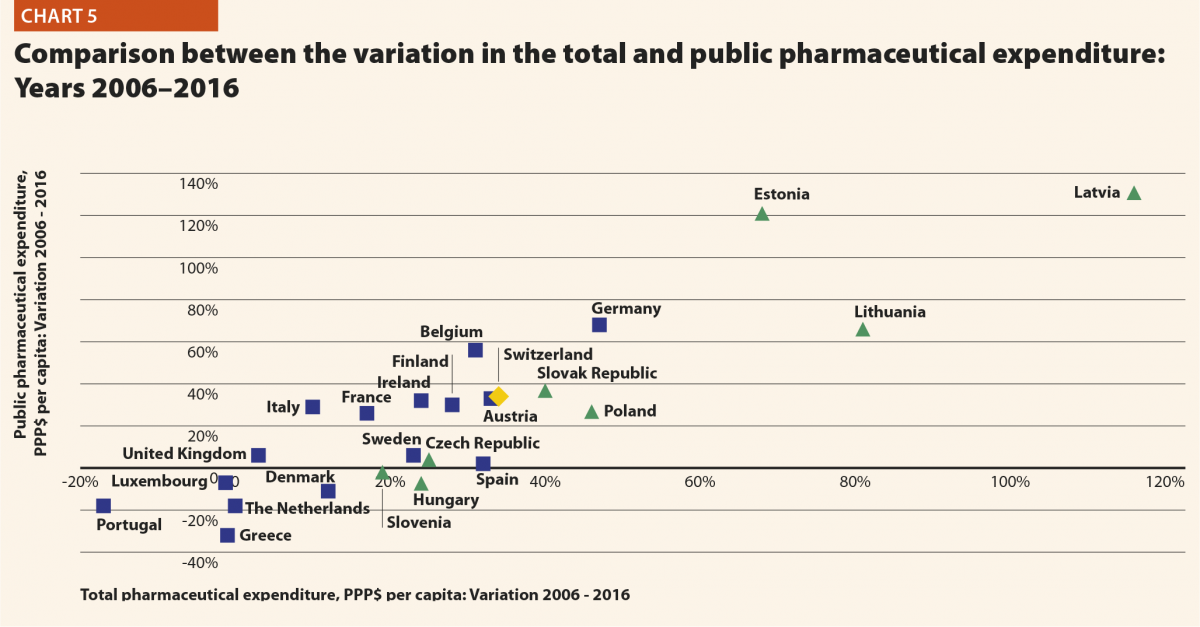
From 2006 and 2016 in the EU, the total pharmaceutical expenditure decreased more than the public pharmaceutical expenditure, which decreased as well but at a slower pace. This suggests that a progressively larger part of the total pharmaceutical expenditure pertains to the private sector. This shift may also indicate that the ‘willingness to pay’ and the consumption of pharmaceuticals by private owners are increasing.
Hospital capacity and delivery of care
In the last 15 years, healthcare reforms or other initiatives implemented all over Europe aimed at rationalising the use and provision of hospital care, improving its quality and appropriateness, and reducing its costs. The number of hospital facilities decreased in most of the countries while the number of hospital beds dropped off on average. These reforms/initiatives also resulted in a broad reduction of acute care admissions and length of stay, as well as in improvements in the occupancy rate of acute care beds.
During these years, almost all European countries had changes in their hospital provision patterns, and major efforts were made to deliver better services, increase quality, and improve efficiency and productivity. The streamlining of care delivery started from a sharp reduction in the size of secondary care institutions and moved towards more integrated and efficient patterns of care, which might result in completely overcoming the hospital-centric model of care in the future.
This was possible thanks to a package of financial and organisational measures addressed to improve coordination and integration between the different levels of care, increase the use of day-hospital and day-surgery and introduce new and more efficient methodologies of hospital financing in order to incentivise appropriateness (for example, the replacement of daily payments – known to encourage longer hospitalisation – by prospective payment).
In most European countries, these policies led to changes in the management of patients within hospitals and offered a possibility to reduce the number of acute care hospital beds. Only the bed-occupancy rates, registered more disparate trends across Europe, depending also from the demographic and epidemiological structure of population and from the specific organisation of local, social and healthcare systems, i.e. the structure of primary care, the presence and the efficiency of a gate-keeping system, the modality of access to secondary care, availability of home care and development of community care.
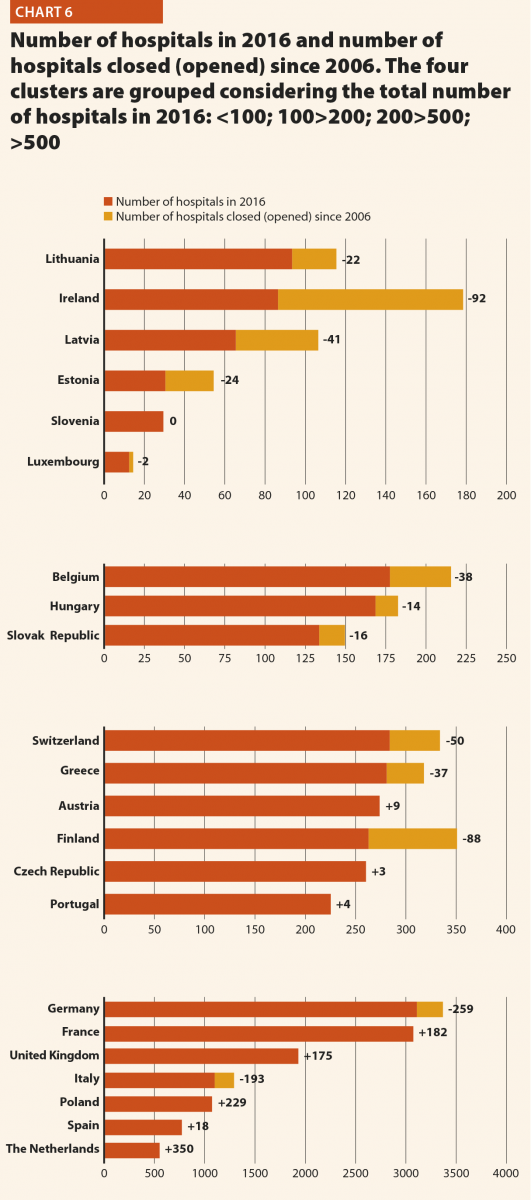
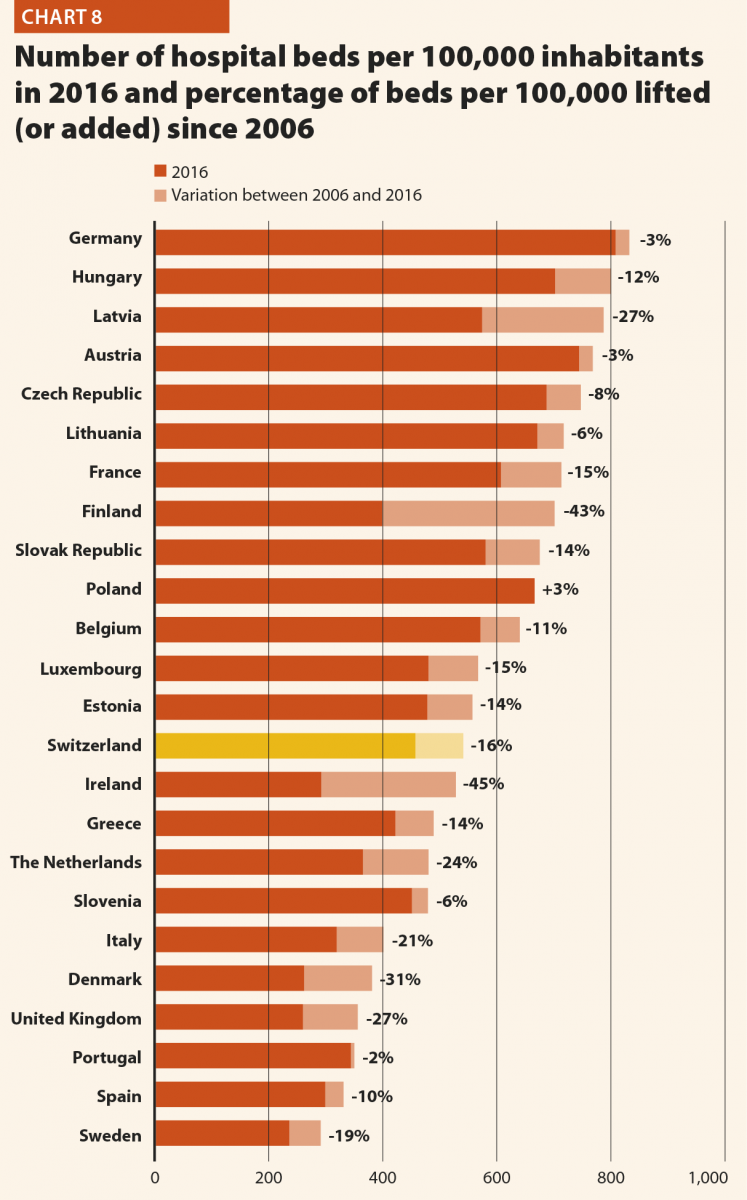
In 2016 there were on average 2.7 hospitals for 100,000 inhabitants, ranging from 1.4 in Slovenia to 4.8 in Finland. Moreover, there were on average 484 hospital beds for 100,000 inhabitants, ranging from 234 in Sweden to 806 in Germany.
Between 2006 and 2016 little change in the number of hospitals was registered in Luxembourg (–2), Slovenia (0) and Czech Republic (+3) (Chart 6). Major increases were registered in the United Kingdom (+175), France (+182), Poland (+229) and The Netherlands (+350). Major decreases were registered in Germany (–259), Italy (–193) and Ireland (–92).
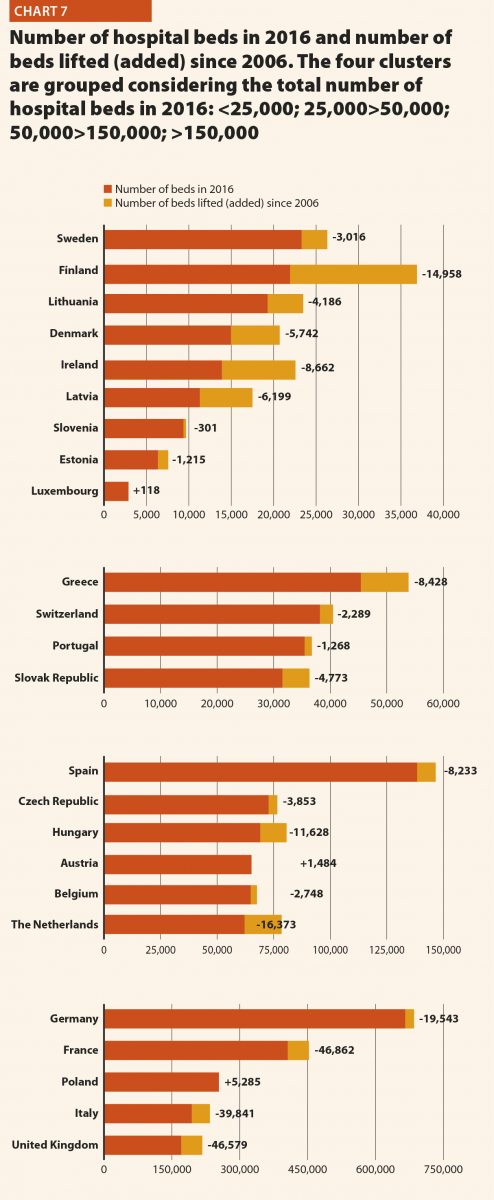
In the same period, the total number of hospital beds decreased by 14% ranging from –41% in Finland (which means 302 beds cut every 100,000 inhabitants) and –3% in Germany (which means 24 beds cut every 100,000 inhabitants) (Chart 7). Positive variations have been registered in Poland (+2%), Austria (+2%) and Luxembourg (+4%). In Poland, the total number of hospital beds per 100,000 increased of 17 units. In Luxembourg and Austria, such increase corresponded to a reduction of the total number of beds per 100,000 inhabitants of 87 and 24 units, respectively.
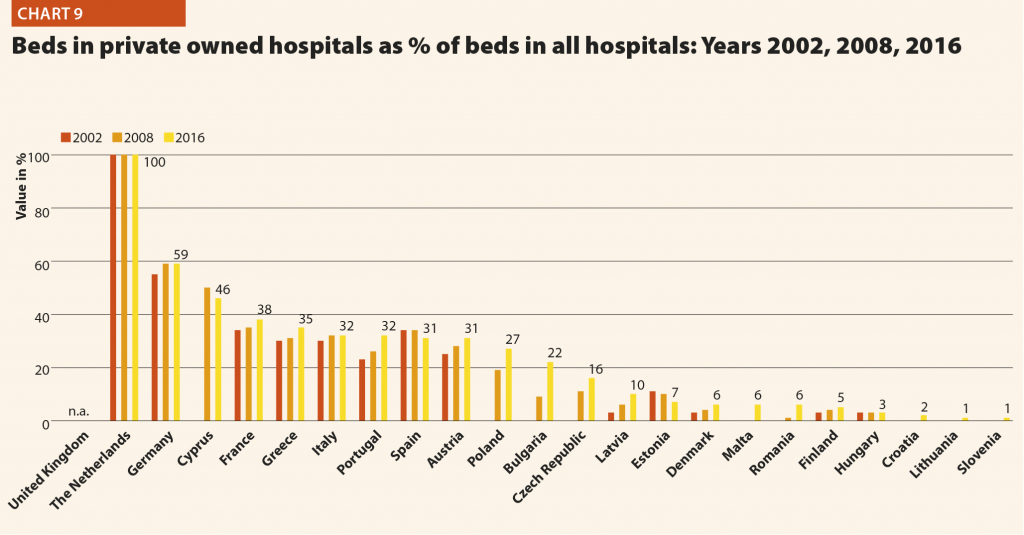
In several countries, the decrease in the total number of beds was accompanied by a slight increase in the number of private inpatient beds, which are inpatient beds owned by not-for-profit or for-profit private institutions. In 2016, in most of the countries where the data are available, the beds in private owned hospitals as a percentage of all beds ranged from 1% in Slovenia and Lithuania to 38% in France. The figures were higher in Cyprus (46%), Germany (59%) and The Netherlands (100%).
The rate of acute care hospital beds for 100,000 inhabitants in 2016 in the EU ranged from 215 in Sweden to 606 in Germany. The highest figures were seen in Belgium (503), Austria (555) and Lithuania (581), whereas the lowest figures were in Spain (241), Denmark (252) and Italy (262).
Between 2006 and 2016, the number of acute care hospital beds per 100,000 population reduced on average by 13% in EU. The most significant decreases were in Latvia (–36%), Denmark (–32%) and Hungary (–28%). The only exceptions were Ireland (+1%), The Netherlands (+1%) and Poland (+6%).
The reduction in the number of hospital beds relates especially to the public providers. In the countries where data are available, this trend is associated with an increase of hospital beds in private organisations. This is the case in Austria, Bulgaria, Croatia, Czech Republic, Germany, Latvia, Lithuania, Poland, Portugal and Romania. The countries that registered a decrease in both categories are Cyprus, Denmark, Estonia, Finland, France, Greece, Hungary, Italy, Malta, Slovenia and Spain.
The number of acute care discharges involves the entire pathway of hospitalisation of a patient, who normally stays in hospital for at least one night and then is discharged, returns home, is transferred to another facility, or dies. Curative care comprises health care contacts during which the principal intent is to relieve symptoms of illness or injury, reduce the severity of an illness or injury, or to protect against exacerbation and/or complication of an illness or injury that could threaten life or normal function. Curative care includes all components of curative care of illness (including both physical and mental/psychiatric illnesses) or treatment of injury; diagnostic, therapeutic and surgical procedures and obstetric services. It excludes rehabilitative care, long-term care and palliative care.
In 2016, the rates of acute care hospital discharges in the European countries were quite dissimilar, ranging from 10% in the Netherlands and Italy to 24% in Austria and Denmark.
The average length of stay measures the total number of occupied hospital bed-days, divided by the total number of discharges. In 2016, the average length of stay in acute care hospitals ranged from 5 bed-days in the Netherlands and Greece to 8 bed-days in Germany and Luxembourg.
Between 2006 and 2016 the number of inpatient discharges in acute care hospitals remained on average stable; however, the indicator varied consistently across the EU member states. Major decreases were registered in Latvia (–36%), Hungary (–25%) and Italy (–23%), whereas major increases were registered in Germany (+17%), Poland (+20%) and Switzerland (+25%).

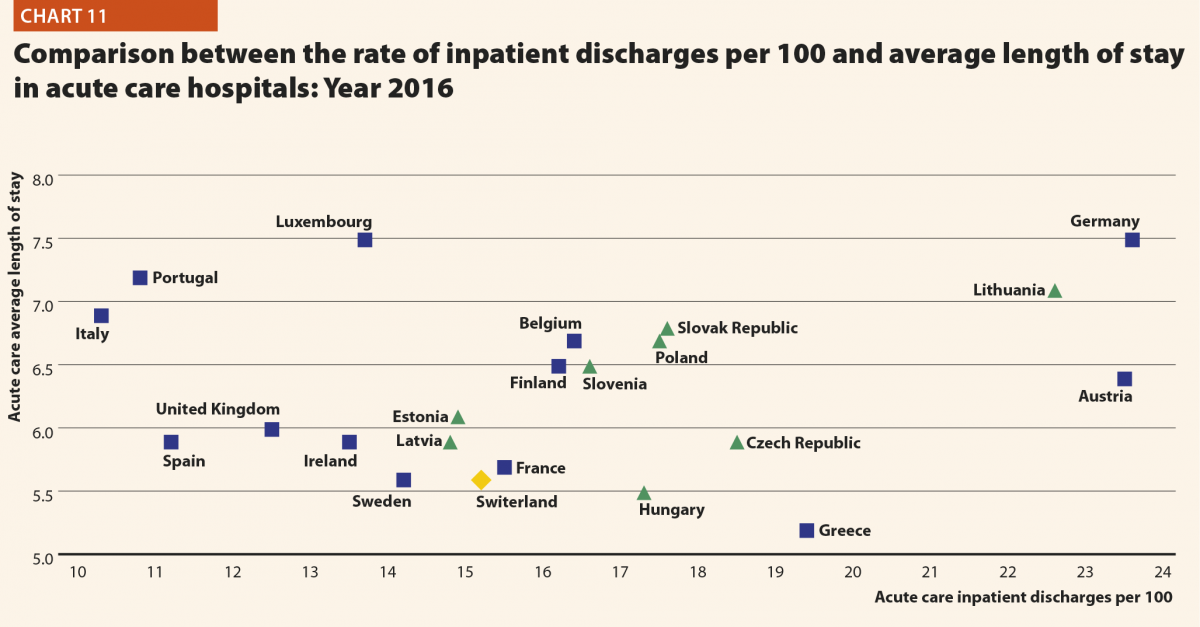
The link between the rate of admissions and the length of stay can be a very sensitive issue for hospitals, because it is commonly acknowledged that too short a length of stay may increase the risk of re-admissions, resulting in consequent waste of resources not only for the hospital but also for the patients and their carers. At the same time, staying too long in a hospital may indicate inappropriate settlements of patients, causing also a waste of resources.
Chart 11 compares the rate of hospital discharges and the average length of stay in acute care hospitals in 2016. The last updated data shows that the average European figures corresponds to a mean rate of discharges by 16% and a mean length of stay of 6 days for acute care hospitals. Chart 11 shows that both indicators are higher than the EU average in Austria, Belgium, Finland, Slovenia, Poland, Slovakia, Lithuania and Germany.
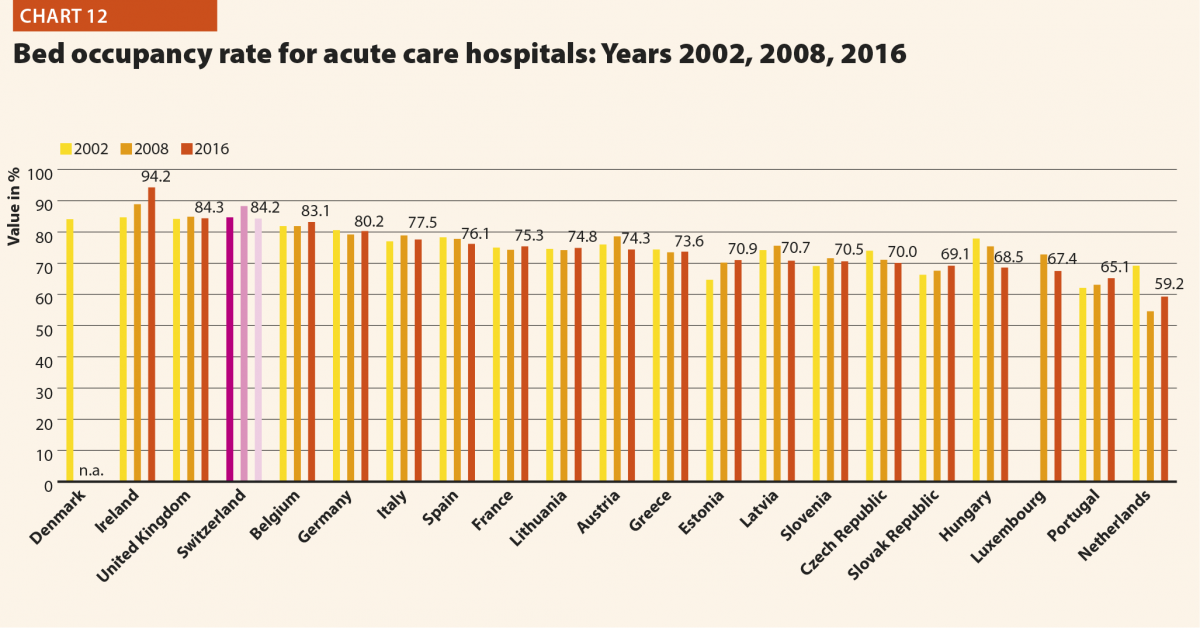
The bed occupancy rate represents the average number of days when hospital beds are occupied during the whole year and generally mirrors how intensively hospital capacity is used.
Between 2006 and 2016, the average rate of acute bed occupancy decreased in Europe. The reduction was encompassed between –8.4 p.p. and –8.2 p.p. in the Czech Republic and The Netherlands, respectively, and –0.5 in Estonia and Italy. The increase ranged between +0.8 p.p. and +2.8 p.p. in the United Kingdom and Germany, respectively. In Ireland, the increase was 7.5 p.p. These large variations are usually due to changes in the number of admissions, average length of stay and the extent to which alternatives to full hospitalisation have been developed in each country (Chart 12).
Hospital and healthcare workforce
Despite the growing interest in self-treatment and the growing role of eHealth and mHealth, health workers remain the crucial component of health systems, providing health services to the population. Jobs in the health and social sector now account for more than 10% of total employment in many OECD countries. Despite the tendency for the number of health care workers to grow in the last 15 years, policy makers are raising issues about the upcoming retirement of the ‘baby-boom’ generation of doctors and nurses, exacerbating the workforce shortage in the health field. Health workforce concerns have shifted from worries on shortages towards issues related to the right skill-mix, to better respond to evolving population health needs (Health Workforce Policies in OECD Countries, OECD March 2016).
According to the European Commission supplement to the quarterly review on ‘Health and social services from an employment and economic perspective’ (December 2014), there are large imbalances in skills levels, and working patterns and recruitment and retention are conditioned by demanding working conditions. The financial constraints are leading in most European countries to a decrease in the resources available for healthcare professionals, reducing the possibilities of hiring new staff. Additionally, several countries, especially in Central and Eastern Europe, are experiencing migrations of their healthcare workforce.
European countries, European Organisations and EU institutions are discussing possible impacts and achievable solutions to these issues. Interestingly, several countries are shifting competences from doctors to nurses, creating new educational pathways and bachelor degrees addressed to nurses. In many cases nurses and general practitioners acquire new skills and competences relieving the burden of hospital care by enforcing primary care institutions and community services.
The trends described above, are likely to have major impacts on the hospital sector, since inpatient care alone absorbs about a third of the healthcare resources and since the hospital sector gives work to more than half of active physicians.
In 2016, the share of practising nurses per 100,000 registered the lowest values in Greece (325), Latvia (464), Poland (516), Spain (551) and Italy (557) (Chart 15). The highest values belong to Germany (1285), Finland (1426), Denmark (1690) and Switzerland (1702). In the same year, the lowest share of practising physicians was registered in Poland (242), the United Kingdom (278), Luxembourg (288), Ireland (294) and Slovenia (301), whereas the highest values were seen in Germany (419), Switzerland (425), Sweden (427), Lithuania (447) and Austria (513) (Chart 14). Between 2006 and 2016, the number of both practising nurses and physicians increased by 15% in EU, according to information available.
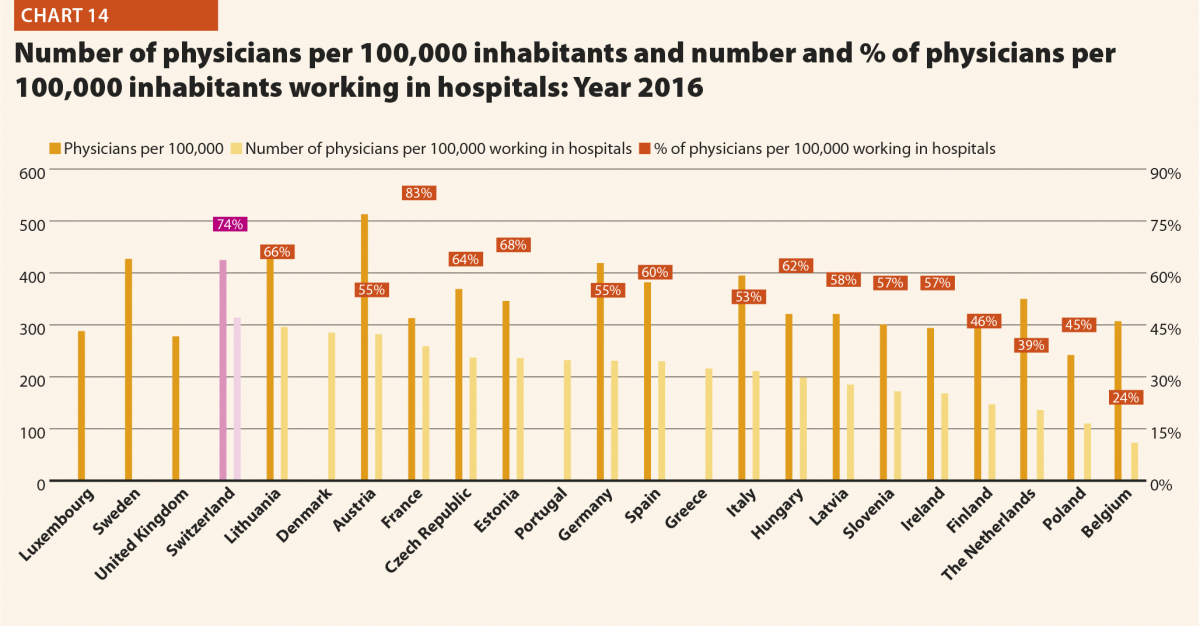
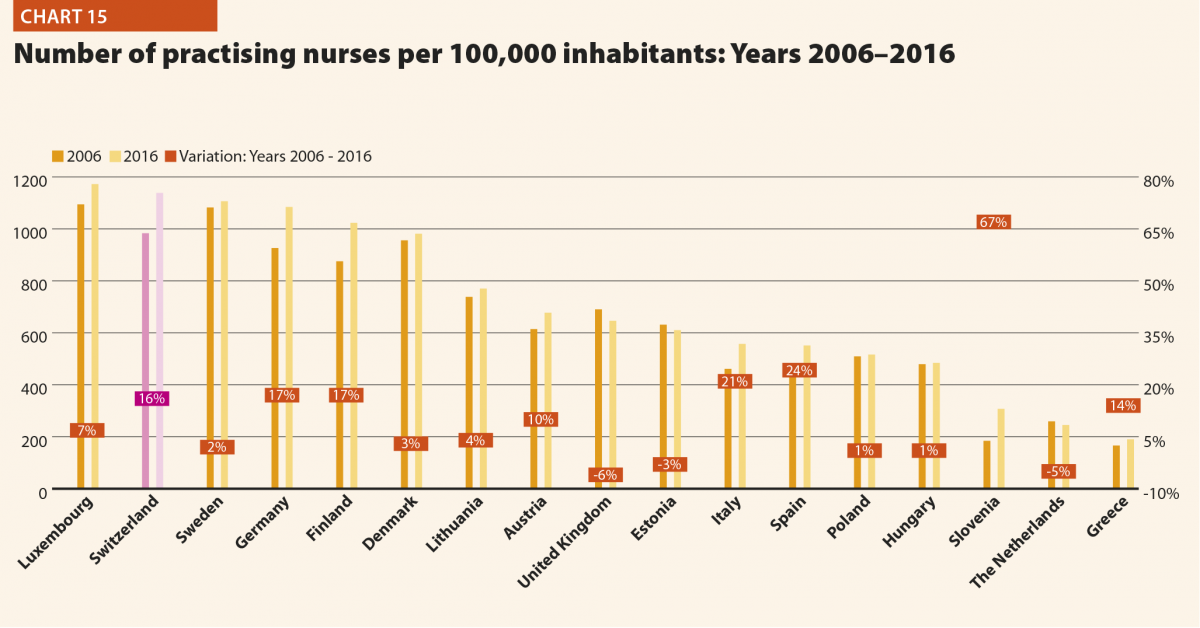
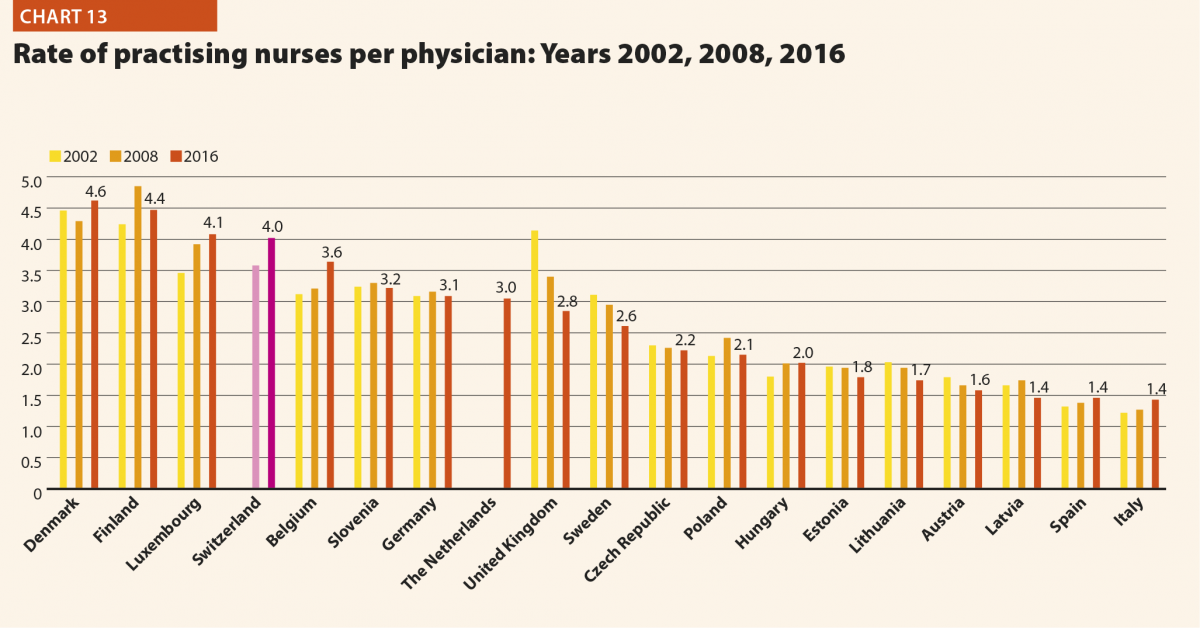
These figures provide evidence of the policies implemented, or at least the trends for the management of healthcare professionals, especially concerning the allocation of resources and responsibilities between physicians and nurses. In the EU, the average rate of nurses per physicians is about 2.4 points. In 2016, the highest values are in Denmark (4.6), Finland (4.4), Luxembourg (4.1), Switzerland (4.0) and Belgium (3.6). In these countries, there is a high shift of competencies from physicians to nurses. Conversely, in countries where the values are lowest – such as Lithuania (1.7), Austria (1.6), Latvia (1.4), Spain (1.4) and Italy (1.4) – physicians continue to perform most of the clinical activities.
In 2016, according to last data available, physicians per 100,000 inhabitants working in hospitals (full or part time) were approximately 50%–60% of the total, with the highest rates registered in Lithuania (66%), Estonia (68%), Switzerland (74%) and France (83%). By contrast, the lowest values were seen in Belgium (24%), the Netherlands (39%), Poland (45%) and Finland (46%).
The most relevant positive variations on the number of physicians working in hospital between 2006 and 2016 were registered in Switzerland (+49%), Germany (+34%) and Hungary (+32%). By contrast, this indicator registered negative variations in Poland (–2%) and Greece (–9%).
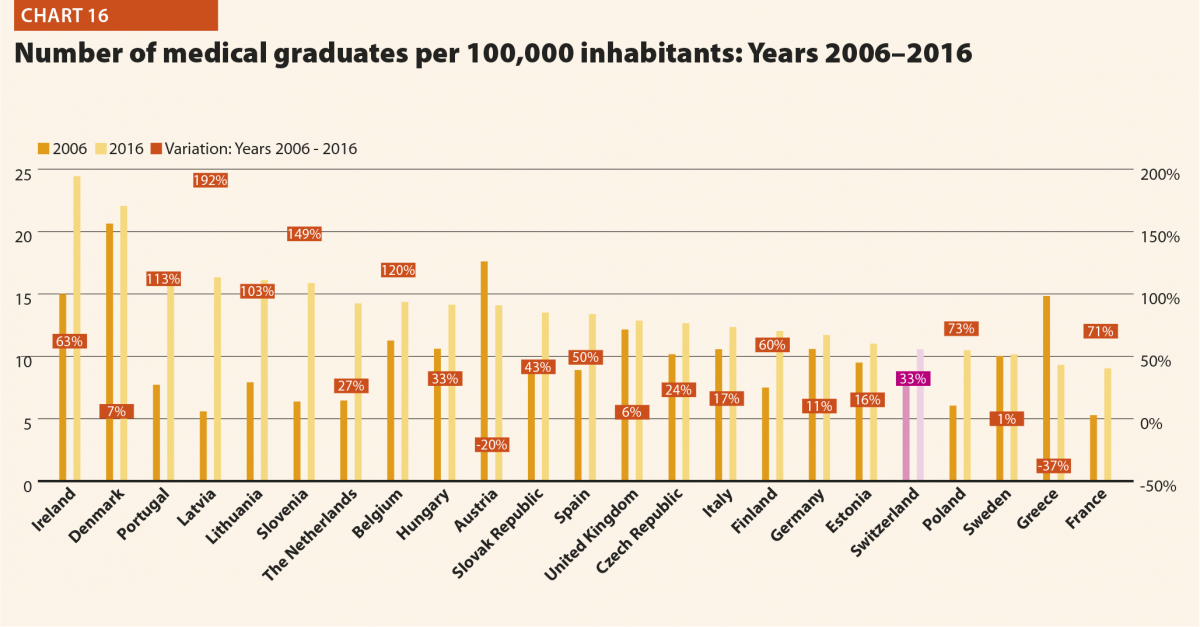
In 2016, the average number of physicians and nurses graduated for every 100,000 inhabitants were respectively about 14 and 42 in the EU; however, the values across countries were quite different. The number of medical graduates per 100,000 inhabitants ranged from 9 in France and Greece to 24 and 22 in Ireland and Denmark, respectively (Chart 16). The number of nurses graduated per 100,000 inhabitants ranged from 15 and 16 in Luxembourg and the Czech Republic to 99 and 104 in Switzerland and Denmark (Chart 17).
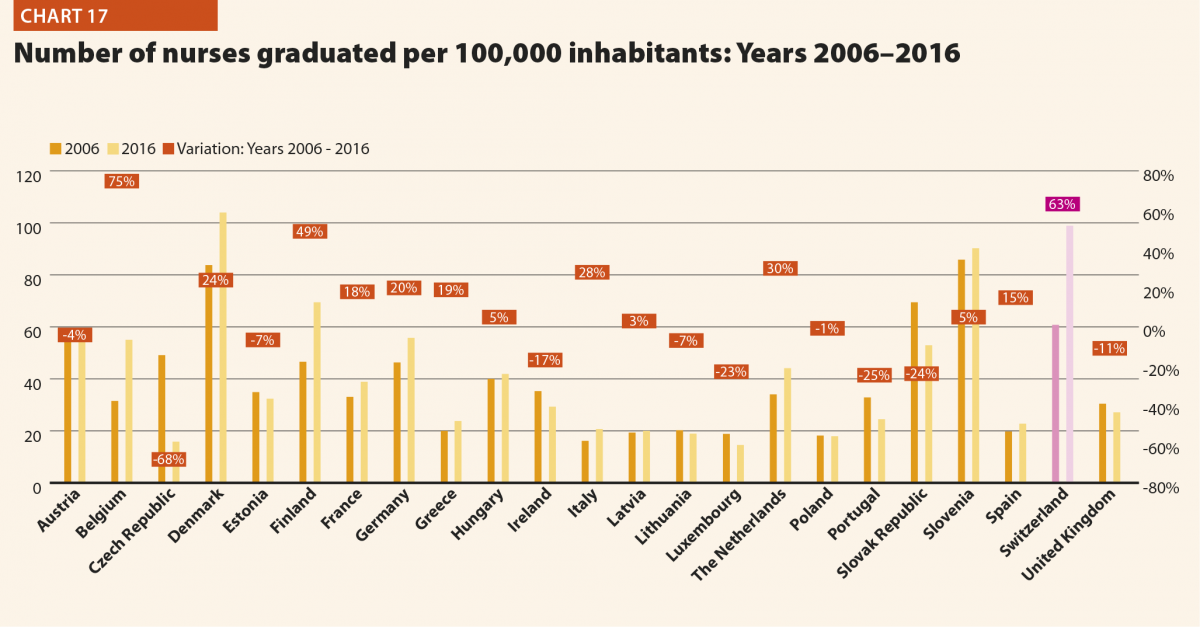
Compared with 2006, the number of medical graduates per 100,000 inhabitants in the EU registered an overall positive variation. The countries that registered the highest increases were Portugal (+109%), Belgium (+137%), Slovenia (+156%) and Latvia (+158%). Minor positive variations occurred in Germany (+11%), Sweden (+11%), Denmark (+12%) and Estonia (+13%). Decreases happened in Greece (–37%) and Austria (–16%). The number of nurses graduated per 100,000 inhabitants registered different trends across the EU. Major positive variations were registered in Belgium (+75%) and Switzerland (+63%), whereas minor positive variations were registered in Latvia (+3%) and Hungary (+5%). Negative variations ranged from –1% and –4% respectively in Poland and Austria, to –24% and –25% in Slovakia and Portugal. The most relevant decrease was registered in the Czech Republic (–68%) in the same years.
