


The figures given here provide the most updated picture of the situation of healthcare and hospitals, compared with the situation at the beginning of the 2000s
For several years, hospitals have been required to act more efficiently and to increase productivity. Increased performance is indeed visible. Yet, healthcare systems are facing conflicting trends: short and long term impacts of an economic and financial crisis; increasing demand of an ever-expanding and ageing population; increasing request and availability of technological innovations; new roles, new skills and new responsibilities for the health workforce.
To adapt to this situation, the role of hospitals is further evolving. Most health systems have already moved from a traditional hospital-centric and doctor-centric pattern of care to integrated models in which hospitals work closely with primary care, community care and home-care.
The figures given in this article provide the most updated comparative picture of the situation of healthcare and hospitals, compared with the situation at the beginning of the 2000s. They aim to increase awareness on what has changed in hospital capacity and more generally in secondary care provision within European Union member states, generating questions, stimulating debate, and in this way fostering information exchange and knowledge sharing.
The sources of data and figures are the Health For All Database (WHO/Europe, European HFA-DB, July 2016), the European Database on Human and Technical Resources for Health (WHO/Europe, HlthRes-DB, July 2016) of the World Health Organisation and OECD Health Statistics (OECD.Stat, October 2016). All European Union member states are considered, plus Switzerland and Serbia (as HOPE has members in both countries). Whenever considered appropriate two groups have been differentiated and compared: EU15, for the countries that joined the EU before 2004 (Austria, Belgium, Denmark, Finland, France, Germany, Greece, Ireland, Italy, Luxembourg, Netherlands, Portugal, Spain, Sweden and United Kingdom) and EU13, for the countries that joined the EU after 2004 (Bulgaria, Cyprus, Czech Republic, Croatia, Estonia, Hungary, Latvia, Lithuania, Malta, Poland, Romania, Slovakia and Slovenia). The considered trends normally refer to the years 2000-2014. When data on 2014 are not available, or they have not been gathered for a sufficient number of countries, the closest year is considered. Some figures are disputed for not being precise enough but at least they give a good indication of the diversity.
Financial resources for healthcare
From 2000 to 2014, the total health expenditure estimated by WHO expressed in purchasing power parity (PPP$) per capita increased on average by 90% in the EU, with effects on inpatient care, out of pocket payments and pharmaceutical expenditures. These three figures are characterised by a growing and positive trend in the considered years.
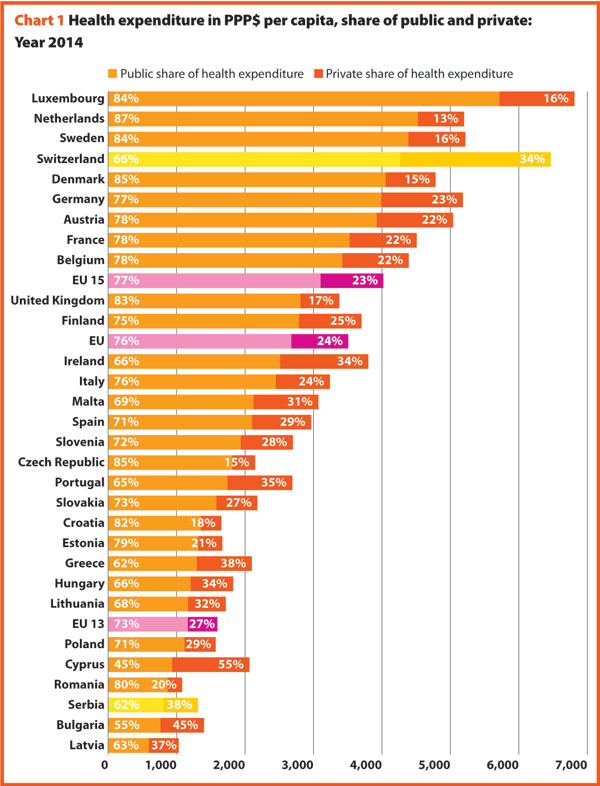
The amount of total health expenditure per capita in 2014 was 3509 PPP$ in the EU, with wide variations around this average value: 4020 PPP$ in EU15 and 1596 PPP$ in EU13. Compared with 2000, the total health expenditure per capita in 2014 had increased in all European countries. In most of them it had more than doubled, but major increases were highlighted in Romania (336%), Bulgaria (264%), Slovakia (260%) and Serbia (248%) where it had tripled or more than tripled.
Public sector health expenditure includes outlays for health maintenance, restoration or enhancement paid by government entities, such as the Ministry of Health, other ministries and parastatal organisations, or by social security agencies. It includes transfer payments to households to offset medical care costs and extra-budgetary funds to finance health. The revenue base of these entities may comprise multiple sources, including external funds.
In 2014, the percentage of public sector health expenditure to the total health expenditure was higher than 70% in most countries, with the exception of Cyprus, Bulgaria, Greece, Hungary, Ireland, Latvia, Lithuania, Malta and Portugal and outside the EU, Serbia and Switzerland.
Between 2000 and 2014, the public health expenditure in PPP$ per capita more than doubled in all the countries belonging to EU13 except in Slovenia (+80%) and Croatia (+88%), while in EU15, this increase was +86% on average. The trend of public expenditure on health in PPP$ per capita registered a positive yearly variation in the period considered. However, it has been observed that starting from 2008, such variation has been less significant than in previous years.
Chart 2 shows the last 14-year trend concerning the share of government expenditure on health. It presents the aggregated data concerning the EU, EU15 and EU13 and the figures of the three countries having the highest and the lowest values in the year 2014, Switzerland included.
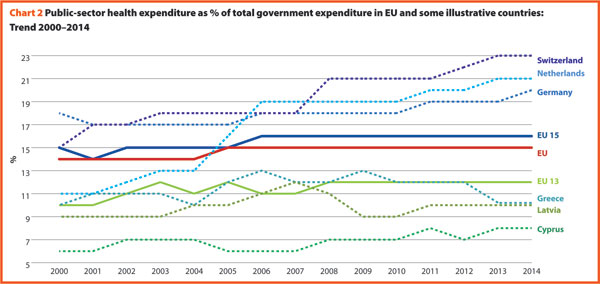
In 2014, the percentages of government expenditure devoted to health differed by 4 percentage points (p.p.) between EU15 (16.2%) and EU13 (11.9%); Switzerland shows a percentage of 22.7%, higher but also growing faster compared to the EU member states.
The trends illustrated in the chart 2 are generally positive between 2000 and 2006 with an average increase of percentage of government outlays devoted to health by 0.2 p.p. per year. Yet, from 2006 onwards, this way of development slacked off in many countries. The reasons can be found in the beginning of economic difficulties or in the shift of interest and priorities to other sectors.
Private households’ out-of-pocket payment on health are the direct outlays of households, including gratuities and payments in-kind made to health practitioners and suppliers of pharmaceuticals, therapeutic appliances, and other goods and services. They include household payments to public services, non-profit institutions or non-governmental organisations, non-reimbursable cost sharing, deductibles, co-payments and fee-for-service.
In 2014 the private households’ out-of-pocket payment in the EU accounted for 16.7% of total health expenditure.
In 2014, the private contribution to healthcare spending was around 15.0% in EU15 and 23.2% in EU13. It was higher than 30% in Lithuania (31.3%), Greece (34.9%), Latvia (35.1%), Bulgaria (44.2%), Cyprus (48.7%) and lower than 10% only in the UK (9.7%), France (6.3%) and The Netherlands (5.2%). Between 2000 and 2014 the percentage of private households’ out-of-pocket payment to total health expenditure has steadily declined in the majority of European countries. It reduced by 0.9 p.p. in the EU, 0.7 p.p. in EU15 and by 1.2 p.p. in EU13. The most relevant rates of reduction were registered in Latvia (from 44.1% to 35.1%), Cyprus (from 55.9% to 48.7%), Poland (from 30.0% to 23.5%), Italy (from 25.3% to 21.2%) and Finland (from 22.3% to 18.2%). Nonetheless, the total out-of-pocket payments in PPP$ per capita continued to increase, since the total health expenditure did.
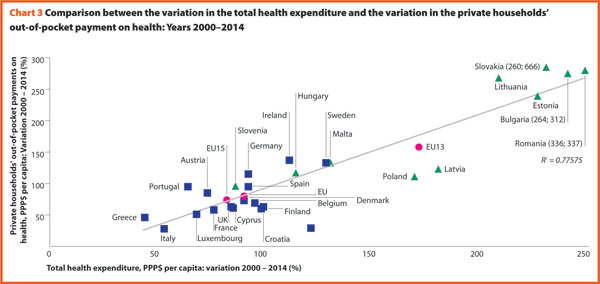
Chart 3 illustrates the trend 2000–2014 of both the total health expenditure per capita and the private households’ out-of-pocket payments on health. These values present a correlation (R² = 0.7757) showing that there is dependence between the two indicators. The chart highlights the fast growth of both expenses in most countries of EU13 (graphically, this phenomenon corresponds to the fact that these countries are located in the upper-right part of the graph) and a low increase of out-of pocket payment in some countries despite an average increase in total health spending of about 82% in EU15.
A third of health payments finances running expenses (excluding investments and capital outlays) of inpatient institutions for acute, chronic and convalescent care. The funds allocated to outpatient institutions or outpatient hospitals are excluded from this computation because they are included in the ambulatory care expenses. This separation is sometimes not statistically possible for some countries; hence a quote of overlap must always be assumed.
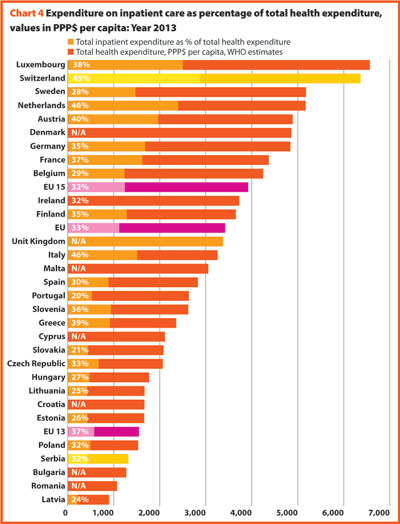
About a third of total health expenditure supports the delivery of inpatient care.
In 2013, expenditure on inpatient care represented on average 32.7% of overall healthcare spending, ranging respectively from 19.8% and 21.0% in Portugal and Slovakia, to approximately 46.0% in Italy and The Netherlands. In all countries, even if a part of the total health expenditure is always funded by private insurances and out-of-pocket payments, almost the entire amount of inpatient health expenditure is publicly financed.
Last data available on expenditure on inpatient care PPP$ per capita refers to year 2013 and is available for 20 EU countries. For those countries, the total expenditure on inpatient care (PPP$ per capita) follows, on average, a growing positive trend. The exception is represented by Greece where data available shows that this indicator varies negatively (-14.0%).
Pharmaceutical expenditure includes the consumption of prescribed medicines, over the counter and other medical non-durable goods. The most recent data referring to 2014 is about pharmaceutical expenditure as share of current expenditure on health. The countries that registered the lowest rates of this indicator are Denmark (6.7%), The Netherlands (7.6%), Luxembourg (8.4%) and Sweden (9.6%) while the highest one concern Latvia (26.8%), Slovakia (27.0%), Greece (28.4%) and Hungary (30.2%).
Between 2000 and 2014 the percentage of pharmaceutical expenditure on total current health expenditure has generally declined in all of Europe. In 2014, the total pharmaceutical expenditure was encompassed between 292 PPP$ per capita in Estonia and 678 PPP$ per capita in Germany. At least half of it was held by the public sector in all countries except Hungary (49.0%), Slovenia (48.0%), Denmark (44.4%), Latvia (35.5%) and Poland (33.5%). The highest values in 2014 were in Germany (83.3%), Luxembourg (80.7%), The Netherlands (80.4%), Slovakia (71.5%) and France (71.1%). In 2014 the pharmaceutical expenditure in PPP$ per capita held by the public sector was encompassed between 105 in Poland and 565 in Germany.
Chart 5 explores the relationship between the trend of the total and the public pharmaceutical expenditure between 2000 and 2014. In a group of outlier countries (upper right part of the chart) encompassing Estonia, Ireland and Slovakia, both the public and the total spending varies more than 60%. Only in Denmark, Luxembourg, and Portugal, both the indicators varies negatively.
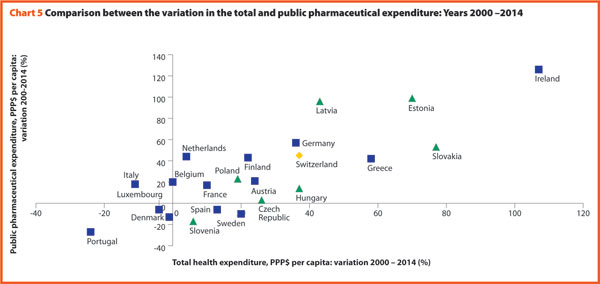
In Europe, both the total pharmaceutical expenditure and the public pharmaceutical expenditure PPP$ per capita increased from 2000 to 2009 and decreased from 2009 to 2011. In almost all the member states, the total pharmaceutical expenditure decreased more slowly than the public pharmaceutical expenditure. This suggests that a progressively larger part of the total pharmaceutical expenditure pertains to the private sector. This shift may also indicate that the “willingness to pay” and the consumption of pharmaceuticals by private owners are increasing.
Hospital capacity and delivery of care
In the last 14 years, healthcare reforms implemented all over Europe aimed at rationalising the use and provision of hospital care, improving its quality and appropriateness, and reducing its costs. The number of hospital facilities as well as the number of hospital beds dropped off. But these reforms also resulted in a broad reduction of acute care admissions and length of stay, as well as in improvements in the occupancy rate of acute care beds.
During these years almost all European countries made changes in their hospital provision patterns, major efforts were addressed to delivering better services, increasing quality, improving efficiency and productivity. The streamlining of care delivery started from a sharp reduction in the size of secondary care institutions and moved towards more integrated and efficient patterns of care, which might in the future result in the complete overcoming of the hospital-centric model of care.
This was possible thanks to a package of financial and organisational measures addressed to improve coordination and integration between the different levels of care, increase the use of day-hospital and day-surgery and introduce new and more efficient methodologies of hospital financing in order to incentivize appropriateness (for example, the replacement of daily payments – known to encourage longer hospitalisation – by prospective payment).
In more or less all European countries, these policies led to changes in the management of patients within hospitals and offered a possibility for reducing the number of acute care hospital beds. Only the bed occupancy rates registered more disparate trends across Europe, depending also from the demographic and epidemiological structure of population and from the specific organisation of local, social and healthcare systems, that is, the structure of primary care, the presence and the efficiency of a gate-keeping system, the modality of access to secondary care, availability of home care and development of community care.
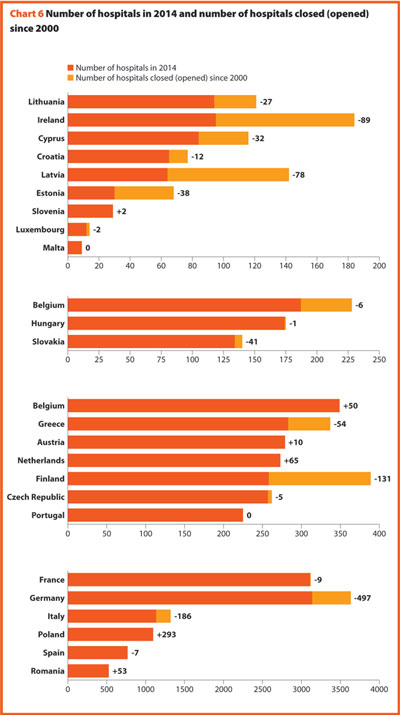
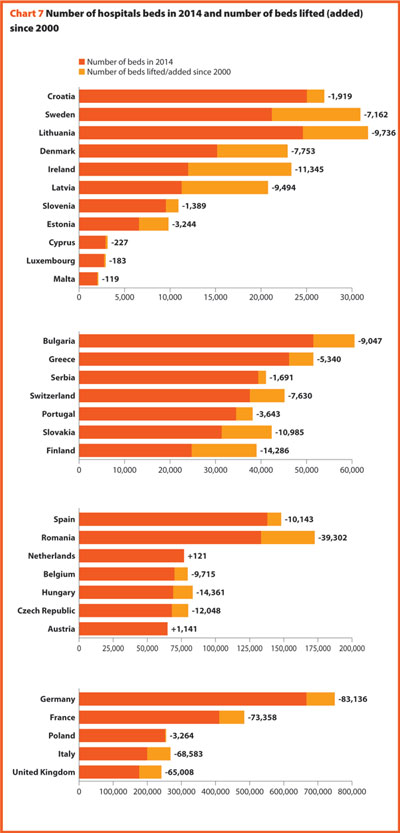
Between 2000 and 2014 the average number of hospitals and hospital beds decreased by about 9.4% and 17.5%, respectively.
In 2014, there were on average 2.9 hospitals for 100,000 inhabitants, ranging from 1.4 in Slovenia to 4.9 in France. The only European member state excluded from this range is Cyprus, where the value is around 9.9. Moreover, there were on average 522 hospital beds every 100,000 inhabitants, ranging from 254 in Sweden to 823 in Germany.
Between 2000 and 2014 little changes in the number of hospitals were registered in Luxembourg (-2), Hungary (-1) and Slovenia (+2).
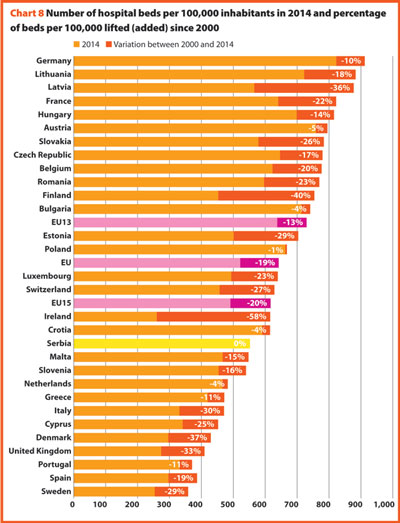
In the same period, the total number of hospital beds per 100,000 inhabitants decreased by 18.8%, ranging from -57.8% in Ireland (which means 356 beds cut for every 100,000 inhabitants) and 0.4% in Serbia (two beds cut for every 100,000 inhabitants).
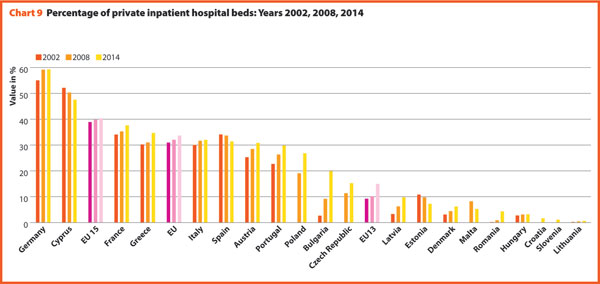
In several countries, the decrease in the total number of beds was accompanied by a slight increase in the number of private inpatient beds, which are inpatient beds owned by not-for-profit and for-profit private institutions. But the share of private hospital beds – where figures are available – was still quite low in most countries, with percentages higher than 30% only in Spain (31.4%), Italy (32.0%), Greece (34.7%), France (37.7%), Cyprus (47.6%) and Germany (59.3%).
In almost all European countries acute care hospitals represent at least half of the total number of hospitals.
Between 2000 and 2014, the number of acute hospitals decreased significantly all over Europe. A total of 357 acute care hospitals were closed in Germany, 193 in France, 170 in Italy and 122 in Switzerland.
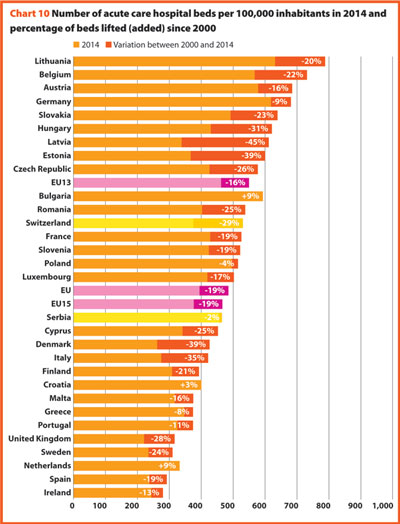
The rate of acute care hospital beds for 100,000 inhabitants in 2014 in Europe was 394. The highest figures were observable in Belgium (567), Austria (578), Bulgaria (593), Germany (618) and Lithuania (631); the lowest figures in the United Kingdom (228), Sweden (235), Spain (238), Ireland (244) and Denmark (262).
Between 2000 and 2014, the number of acute care hospital beds per 100,000 populations registered an average reduction by 18.7% in the EU, 19.3% in the EU15 and 16.0% in the EU13. The most significant decreases were in Latvia (-44.7%), Estonia (-38.8%) and Denmark (-38.5%). The only exceptions were Croatia (+2.9%), The Netherlands (+8.9%) and Bulgaria (+9.3%).
The reduction in the number of hospital beds regards especially the public providers. In the countries where data is available, this trend is usually associated with an increase of hospital beds in private structures. This is the case in Austria, Bulgaria, Denmark, Greece, Latvia, Lithuania and Portugal. In Cyprus and Malta, the situation is the opposite (increase of number of beds in public hospitals and decrease in private hospitals). The countries that registered a decrease in both cases are Estonia, France and Spain.
The number of acute care admissions involves the entire pathway of hospitalisation of a patient, who normally stays in hospital for at least 24 hours and then is discharged, returning home, being transferred to another facility or dying. Last data available for this figure refers to 2014. The rates of acute care hospital admissions in the European countries were quite dissimilar, ranging from 7.8% in Cyprus to 24.5% in Austria.
The average length of stay measures the total number of occupied hospital bed-days, divided by the total number of admissions or discharges. In 2014, the average length of stay in acute care hospitals ranged from 3.5 bed-days in Denmark to 7.6 bed-days in Germany. In Serbia this value is 8.4 bed-days.
Between 2000 and 2014, almost all countries stabilised their rate of admissions for all hospitals. On average, this figure decreased 0.5 p.p. (from 17.8% to 17.3%). Most of them were also able to reduce the length of stay in acute care hospitals. Indeed, the EU average improved, decreasing from 7.6 bed-days in 2000 to 6.4 bed-days in 2014.
Data suggest that in the EU, about 17.3% of population is admitted to hospital every year and that their average length of stay is around 8 days.
The link between the rate of admissions and the length of stay can be a very sensitive issue for hospitals, because it is commonly acknowledged that too short length of stay may increase the risk of re-admissions with a consequent waste of resources both for the hospital and for the patients and their carers. At the same time, staying too long in a hospital may indicate inappropriate settlements of patients, causing similar waste of resources as described above.
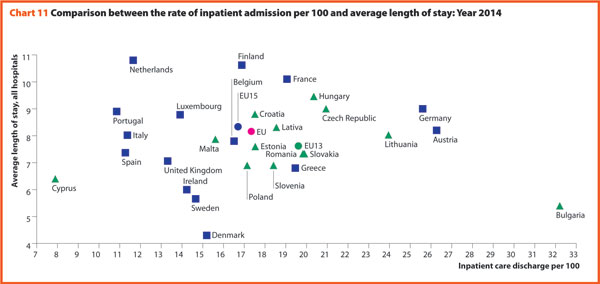
Chart 11 compares the rate of hospital admissions and the average length of stay in 2014. The average European figures indicate a mean rate of admissions by 17.3% and a mean length of stay of 8.2 days for all hospitals. The foremost variations between countries concern the admissions ranging from 7.9 in Cyprus to 32.2 in Bulgaria. A cluster of countries mainly encompassing EU13, present a number of admissions per 100 higher than the EU average (17.3). The smallest countries seem to be more successful in finding a good balance between these two indicators.
The bed occupancy rate represents the average number of days when hospital beds are occupied during the whole year and generally mirrors how intensively hospital capacity is used.
In 2014, the average acute care occupancy rate in Europe was equal to 76.9%, but the gap between the highest and the lowest rate was 24.8 percentage points.
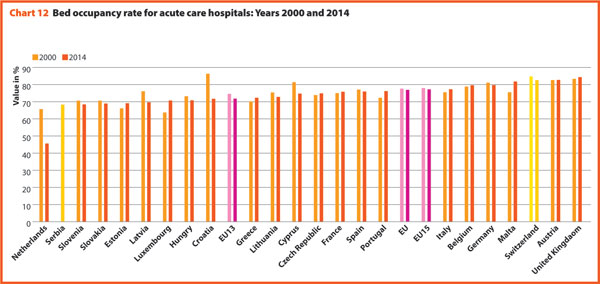
Between 2000 and 2014 there were no consistent trends in Europe, the average rate of acute bed occupancy in EU decreased by 0.7 percentage point, the other values were encompassed between +8.8 p.p. and +0.1 p.p. respectively in Ireland and Austria and -14.6 p.p. and -1.1 p.p. in Croatia and Spain. In The Netherlands, the decrease in p.p. was about 20.1. These large variations are usually due to changes in the number of admissions, average length of stay and the extent to which alternatives to full hospitalisation have been developed in each country.
Hospital and healthcare workforce
In 2014, the share of employment in the human health and social work sector on total employment in the 28 European member states is on average 10.7%, according to the European Commission supplement to the quarterly review on “Health and social services from an employment and economic perspective” (December, 2014). Unlike in the total economy, the number of workers in this sector had been steadily growing, and showed an increase even during the crisis years. Furthermore, the health and social services sector, composed of human health, residential care and social work, has an important economic weight as it generates around 7.0% of the total economic output in the EU28 and appears to have suffered from the crisis.
The review underlines also that the health and social services sector is facing several challenges due to the fact that the workforce is ageing faster than in other sectors. Indeed, the vast majority of the people working in human health and social sector belong to the age group 25–49 years, while the share of people above 50 years increased from approximately 27% to 32% between 2008 and 2013 in EU28. Moreover, there are large imbalances in skill levels and working patterns and recruitment and retention are conditioned by demanding working conditions. The financial constraints, are leading in most European countries to a decrease in the resources available for healthcare professionals, reducing the possibilities of hiring new staff. Additionally, several countries, especially in central and Eastern Europe, are experiencing migrations of their healthcare workforce.
These trends are likely to have major impacts on the hospital sector, since inpatient care, alone, absorbs about a third of the healthcare resources and hospital sector gives work to more than half of active physicians. In 2014, the total hospital employment, per 100,000 inhabitants was 1506 people in EU28, whereas in EU15 and EU13 this value was 1589 and 988, respectively. European countries, European organisations and EU institutions are discussing possible impacts and achievable solutions to these issues. Interestingly, several countries are shifting competences from doctors to nurses, creating new educational pathways and bachelor degrees for nurses. In many cases nurses and general practitioners acquire new skills and competencies relieving the burden of hospital care by enforcing primary care institutions and community services.
An overview of the composition of the European healthcare workforce in 2014 highlights the presence of about 1,600,000 doctors and 3,850,000 nurses with an average rate of about 2.5 nurses per doctor (Chart 13).
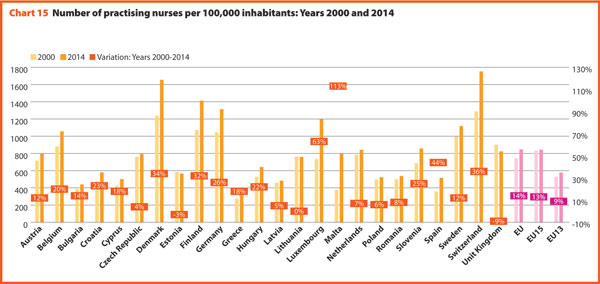
In 2014, EU15 had 359 practicing physicians and 943 practising nurses per 100,000 inhabitants and EU13 had 284 physicians and 577 nurses per 100,000 inhabitants. The majority of the EU13 countries has a number of physicians lower than the EU average. In these countries, the indicator ranged from 231 in Poland to 505 in Austria. The share of practising nurses per 100,000 in EU is on average of about 546.5. The lowest values belong to Greece (320), Bulgaria (440) and Latvia (482) whereas the highest have been reached in Luxembourg (1197), Germany (1314), Finland (1412) and Denmark (1654). Between 2000 and 2014, the number of practising physicians and nurses per 100,000 inhabitants increased respectively by 17% and 14% in EU28.
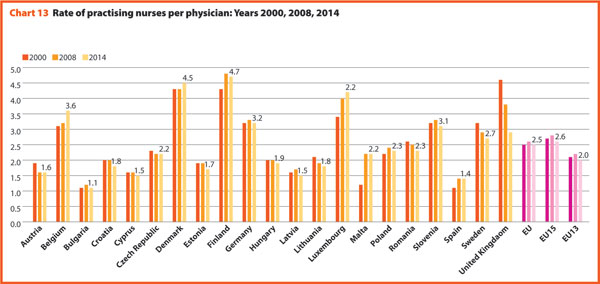
These figures provide evidence of the policies implemented, or at least the trends for the management of healthcare professionals, especially concerning the allocation of resources and responsibilities between doctors and nurses. In EU the average rate of nurses per doctor is about 2.5 points. In 2014 the highest values were in Belgium (3.6), Luxembourg (4.2), Denmark (4.5) and Finland (4.7). In these countries, there is a high shift of competencies from doctors to nurses. Conversely, countries where the values are lower are: Bulgaria (1.1), Spain (1.4), Cyprus (1.5), Latvia (1.5) and Austria (1.6).
In 2014, doctors working in hospital (full or part time) were around 50% to 60% of the total, with the highest rates registered in France (82.3%) and in Denmark (74.3%). By contrast, the lowest values regard Belgium (23.4) and Cyprus (28.2).
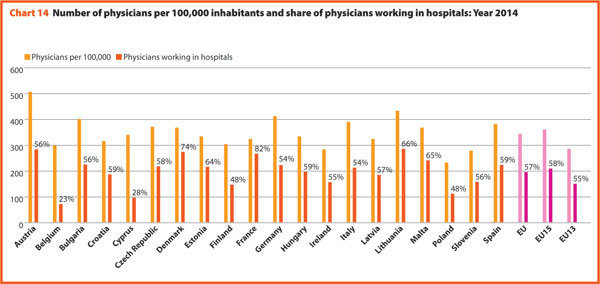
There has been no relevant variation on the share of doctors working in hospital between 2000 and 2014, except in Portugal, Greece and Finland where the figure registered a significant reduction (respectively -15.0, -14.0 and -7.2), and in Hungary (+10.4), Lithuania (+14.3) and Malta (+14.7) where, on the contrary, there was a considerable increase. (Charts 14 and 15).
In 2014, about 12.2 physicians and 38.7 nurses graduated for every 100,000 inhabitants. However, the values across countries were quite different. The number of physicians graduated per 100,000 inhabitants ranged from 9.3 in Greece to 26.2 in Malta. The number of nurses graduated per 100,000 inhabitants ranged from 4.0 in Bulgaria to 92.5 in Denmark.
Compared with 2000, the average number of physicians graduated in the EU per 100,000 inhabitants increased by 27.3%, while the number of nurses graduated per 100,000 inhabitants increased by 38.9%, with a rate particularly high in EU13 where this variation is 55.0%. In EU15 the increase rate is lower than in the EU and equal to 34.4%. The increase in the number of physicians graduated per 100,000 was very high in the three Baltic countries, Portugal and Slovenia. The number of nurses graduated grew especially in Poland, Italy and Latvia. These rates mirror the introduction and extension of the university-level education for nurses (Chart 17).
