


A staff calculation model for emergency departments that can be adjusted to accommodate multiple factors, and therefore be applied to any organisation’s facility, is presented.
Crowded emergency departments (EDs) are dangerous for patients. More preventable medical errors occur during crowding,1 and crowding is associated with an increased patient mortality.2–5 Mortality is a strong outcome parameter, and the problem of crowding has to be taken seriously by hospital administrators. There are many reasons for ED crowding, including staff shortages, and the failure to match staff resources to patient flow.6
Adequate staffing is one of the most important cornerstones of optimising ED performance. Understaffing compromises patient and healthcare provider safety and causes a constant excessive workload. Overstaffing can also cause problems, but this issue has been investigated less due to understaffing being more common. Part of the problem of overstaffing is the heterogeneity of personnel, the effect of which can be described as follows: when a patient arrives and more than one staff member is available, the patient obviously prefers the most experienced person available who generally tends to also be the fastest. This is also preferable from the point of view of the system as a whole as it theoretically leads to the highest throughput.
If staff levels are adequate, the problem does not occur, as the next patient will be assigned to the second most experienced staff member and so on. If the ED is overstaffed, the more experienced staff members are given a new assignment before less experienced staff members have been assigned their first patient.
This disproportionate workload leads to less idle time for the more experienced staff members. There is an observed tendency for more experienced staff with busier schedules to counteract this by prolonging their assignments, for example, through performing unnecessary or untimely investigations, hindering the efficiency of the system as a whole.7
This can quickly lead to a worse service-level than working with fewer personnel because an increase in resource-commitment time decreases the service-level exponentially, whereas additional personnel can only improve throughput linearly. In support of this conclusion, it has been shown recently that ED patients’ average waiting time and length of stay were longer when physicians were assigned patients under a pooled queuing system compared with a dedicated queuing system.8
Staffing an ED is a challenging task. The workload in the ED is unpredictable to a large degree and needs a high level of flexibility and interaction between the different specialities and departments. Due to the unique requirements of an ED it is not appropriate to adopt staffing models from different departments. There are also local circumstances that need to be considered, such as:
- Is the ED a department at a university hospital with an obligation for teaching and research, or a general hospital with a duty primarily with patient care only?
- Does the ED serve as a referral centre level I with complex emergency patients?
- Does the emergency department belong to a teaching hospital with a high number of residents that need to be trained, or a hospital staffed with consultants and specialists only?
- What is the net working time per full time equivalent (FTE) at the hospital?
- What degree of service level should be provided, that is, which proportion of patients should be seen within a certain time period (for example, should 90% of patients be seen within 60 minutes, or 120 minutes?), what is the accepted average waiting time per patient?
In this article we present a staff calculation model for EDs that can be adjusted to accommodate multiple factors, and thus be applied to any ED. It is based on objective data, such as patients per hour and time committed to the patient for the individual triage acuity level. This leads to a transparent, comprehensive and easily reproducible calculation model. The transparency of the model may also be used in staffing-negotiations with the hospital administrators and facilitate the approval of the calculated number of staff tailored to the prerequisites of the individual hospital.
As an example, we will calculate the required number of physicians in a University Hospital ED with 33,000 patient visits per year. The model can be applied equally to nursing staff calculations.
The model
The basic calculation formula for the number of staff needed is shown in Figure 1.

Calculation of total workload
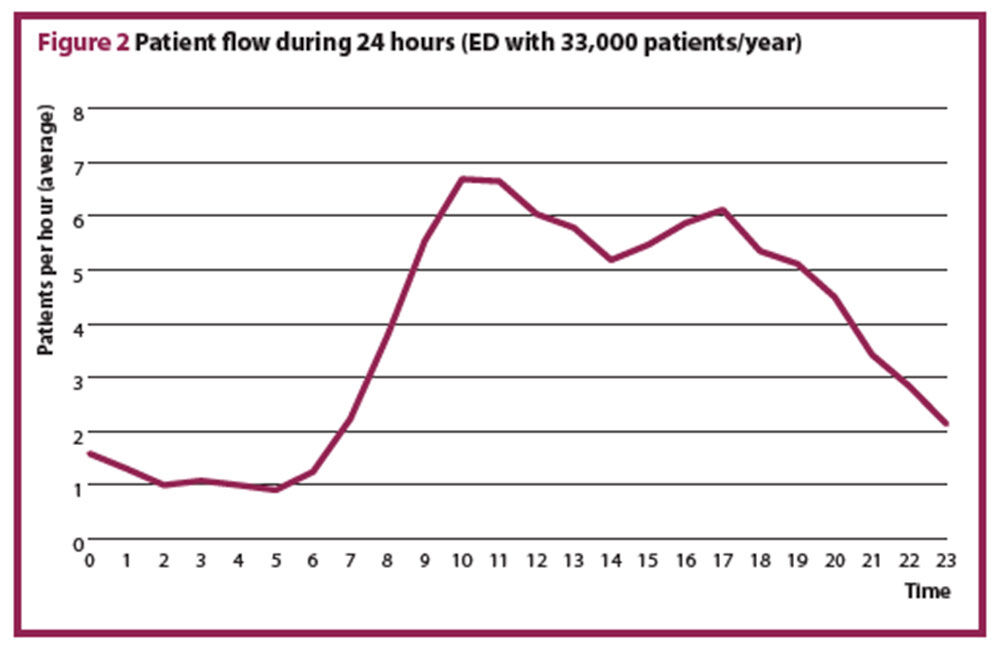
The total workload is the number of patients multiplied by the time spent per patient. Step 3 illustrates that this simplification cannot apply to an ED, it is necessary to use a queuing model to account for the variation in hourly patient presentations. Most EDs have a typical pattern of patients arriving over 24 hours (Figure 2). From these data, it is apparent that the workload cannot be calculated from the average daily patient count, and that any staffing plan should be adjusted to the patient flow over 24 hours.
Step 1
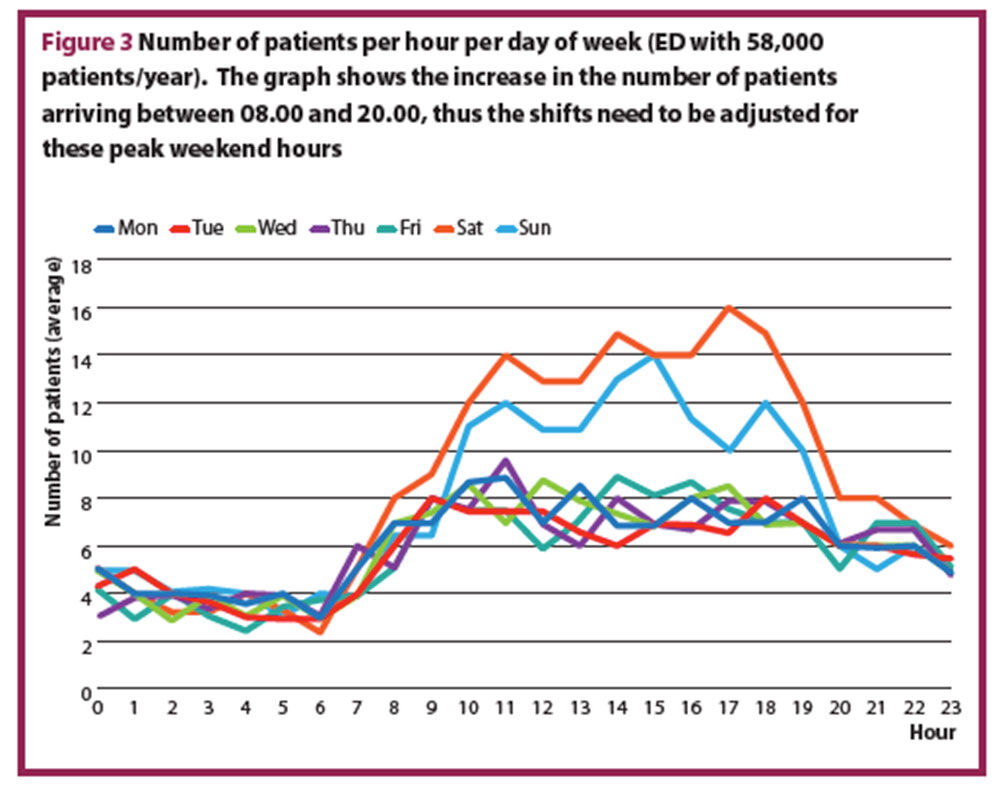
The average number of patients per hour, for each day of the week is calculated. If the variation between the days is larger than 10%, a staffing plan for each day exceeding 10% difference has to be calculated. In most EDs, the average number of presenting patients differs between weekdays and weekends or bank holidays. Figure 3 shows a typical example of the number of patients per hour for each day of week.
Step 2
The average time spent per patient for physician and nursing staff needs to be determined. Average times may be documented and available from your department. If this is unavailable, it can be found in the literature,9–14 and the distribution of patients per triage category used to calculate the weighted average of the time spent per patient. If the distribution of triage categories at your department is not available, it is suitable to use benchmarks from the literature.15–17
Figure 4 shows the distribution of triage categories from USA, Canada, and Australia15–17 and the time needed per patient, per triage category, with the weighted average. An assumption is made that 30% of the patients are admitted. This assumption can be adapted to the situation in any ED. The time per triage category was based on literature9–14 and expert opinion.

Step 3 (pitfalls of simplification, the core of the model)18
To understand the pitfalls of simplification, it is useful to calculate the waiting time and staff utilisation in a simplified ED. In an ideal world, one patient arrives exactly every 15 minutes, and the physician spends exactly 12 minutes with every patient. This means that the physician has a three-minute break after each patient. Because four patients arrive per hour, 12 minutes (four patients x three minutes) are ‘wasted’ time and the staff utilisation is only 80% (48/60). Waiting time is assumed to be zero and service level is 100% in this simplified scenario.
The ‘staff utilisation’ (or occupancy) is a measure of efficiency and refers to the percentage of time spent working in relation to entire work time. The ‘service level’ refers to the percentage of patients seen within one hour.
In reality, patients will not arrive every 15 minutes and the time spent with every patient cannot be 12 minutes for every patient. Random variation leads to a significant change in waiting time, though the average arrival rate is still four patients per hour and average time per patient is 12 minutes. Figure 5 shows the increasing waiting times depending on arrival rate and time per patient as constant or random variable.
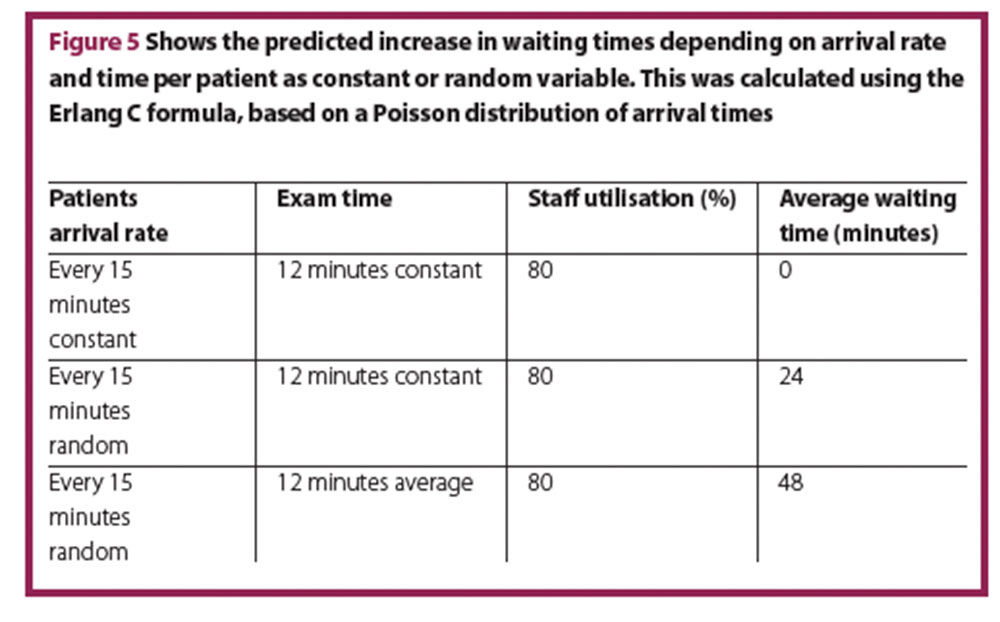
From a CEO’s perspective, there may be too many staff members present in all three scenarios, as staff utilisation is only 80%, but the service level (equivalent to waiting time) is substantially different. Furthermore, ED staff express feeling more stressed in the last scenario despite having the same workload.
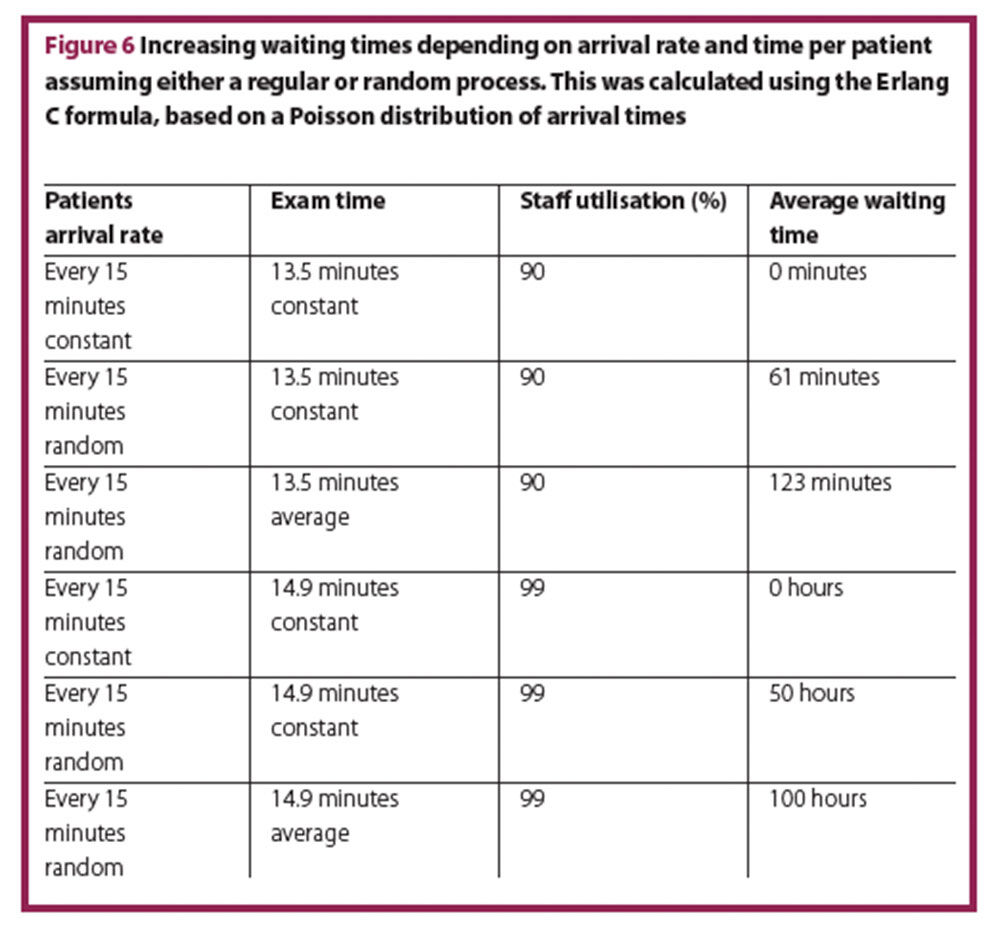
If the time per patient increases only slightly (13.5 minutes instead of 12 minutes), the average waiting time increases considerably. If time per patient continues to increase to almost 15 minutes, the average waiting time will increase to hours, whereas under the assumption of a regular process it would be non-existent (Figure 6).
Higher utilisation rates are more likely to occur in other parts of the hospital, where procedures can be planned. In the ED, a high utilisation rate of resources – both staff as well as equipment – results in a chaotic system with a high and predictable failure rate, and low patient safety with high follow-up costs.
At a critical inflection point, minimal changes in the system will have an inflated effect. Staff utilisation of 80% in an ED is at the brink of being acceptable, if not too risky overall in terms of frequency of system breakdown.
This correlation is more sensitive in EDs with high patient volumes and higher staff numbers, due to the logarithmic nature of data variation. Applying the correct model allows easy use of the complicated calculations. Although the results of the calculations might look like an overestimation at first glance to people who are not aware of the pitfalls of random processes, they reflect the at times the chaotic situation perceived by ED staff. With this model it is easy to determine the inflection point and the critical number of staff needed in the department. It is also easy to determine at which point does more staff not result in any significant improvement of the service level.
To continue the model calculation at this step, an Erlang C queuing model can be applied to calculate the number of staff needed for each unit of time, taking into consideration staff utilisation, average waiting time, and service level (that is, percentage of patients seen within a defined unit of time). As the number of providers for a given number of patients decreases, staff utilisation and waiting time increases. Increasing waiting time is equivalent to a decreasing service level.
The calculations can be made with excel or with an online calculator. The input parameters for this formula are:
- Arrival rate: number of expected patients per hour
- Average service time: weighted average of the time needed per patient for example, 32 minutes (physician, Figure 4A) and 56 minutes (nursing staff, Figure 4B)
- Acceptable waiting time recommended is one hour
- Queue capacity: unlimited in a typical ED.
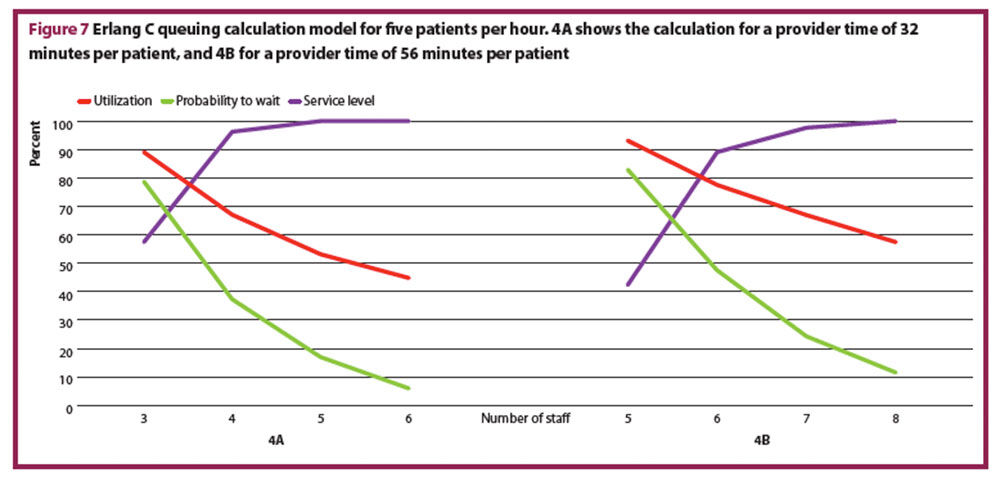
The output parameters will be the service level, the percent delay and the average waiting time for different numbers of staff. The recommended acceptable waiting time is one hour and a service level of at least 90% (with an exception made for low numbers of patients (≤ three/hr). A service level of 90% means that 90% of the patients will be seen within 60 minutes.
Figure 7 shows two calculations for five patients per hour and as well as the respective utilisation rate, waiting time probability, and the service level.
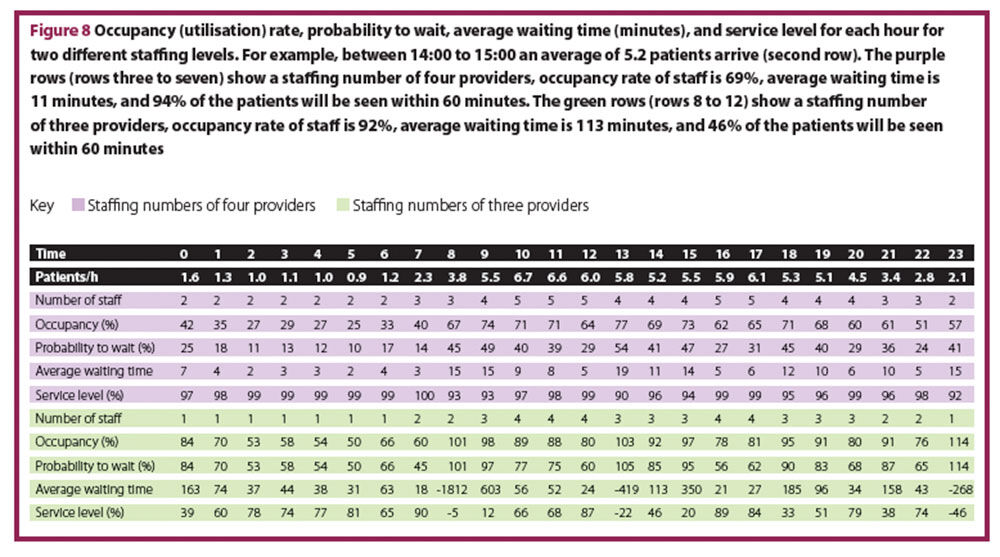
In Figure 8, the utilisation rate, probability to wait, average waiting time, and service level for a fixed number of expected patients each hour at two different staffing levels, have been calculated.
Step 4
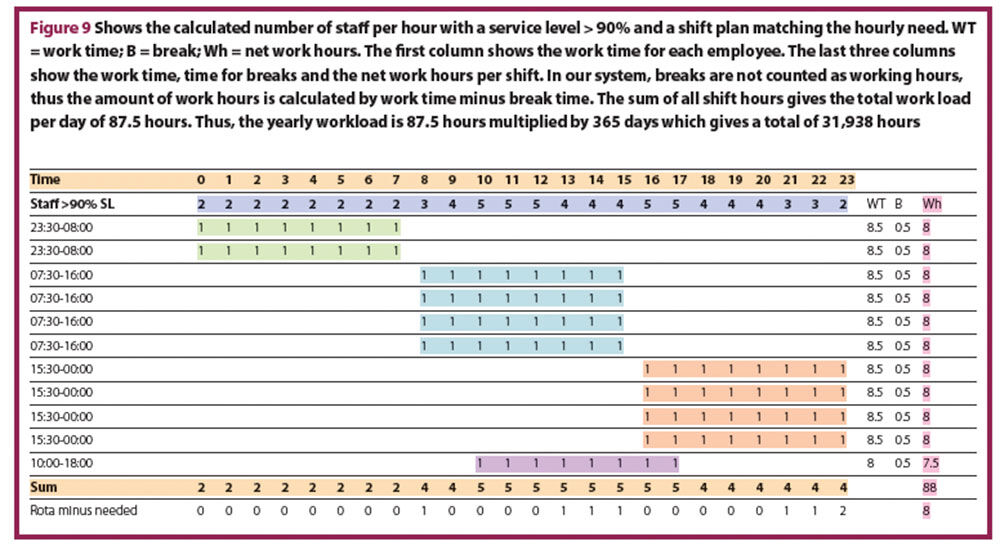
In the third step, the staffing level needed for each one-hour time interval (60 minutes) was calculated. However, the staff level cannot be changed hourly, so the fourth step involves a shift plan designed to fulfil the hourly requirement. Figure 9 shows the calculated number of staff per hour with a service level > 90% (second row in purple “staff >90% SL”) and a shift plan matching the hourly need. In this shift plan, mainly eight hour shifts are used, since working 12 hour shifts is associated with decreased quality of care, patient safety and increased rates of errors, as well as associated with higher rates of burnout, job dissatisfaction and intention to leave.19 The shift plan has also to include time for handover.
Number of hours worked per staff member: how many hours per year do your staff really work?
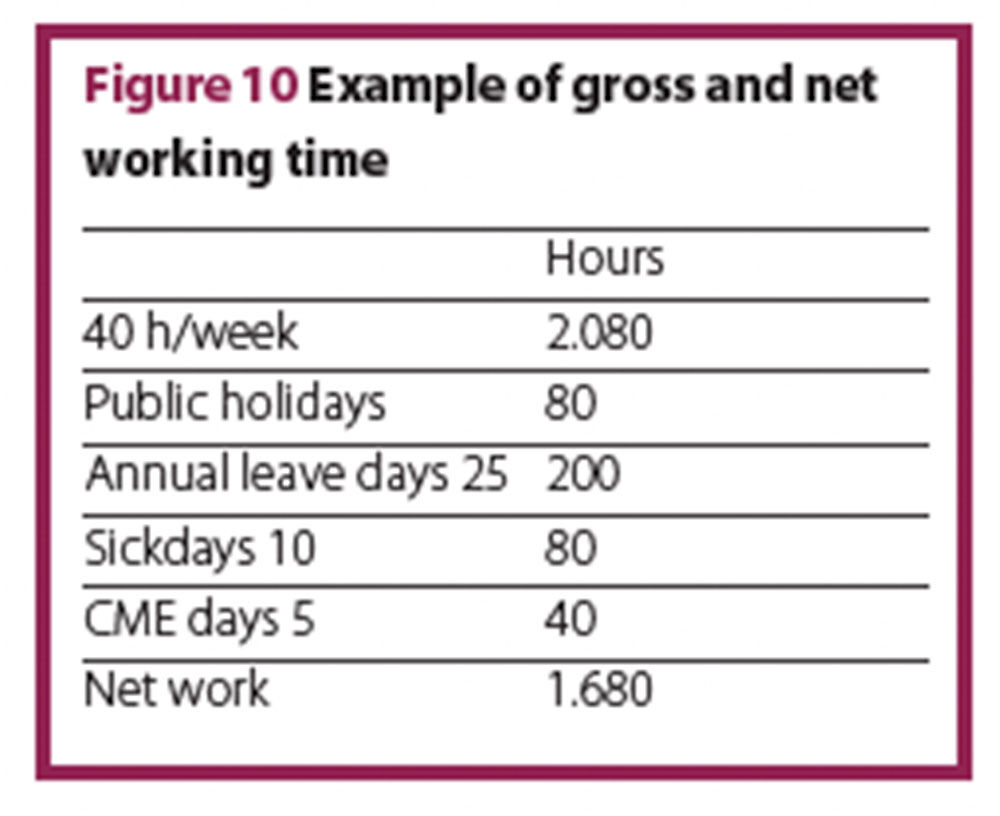
Each full time employee has a certain amount of protected time when they are unavailable. This absence includes holidays, sick days, CMEs, or similar. This leads to a significant difference between gross and the net working hours. Subtracting absence from the gross yearly working time results in the net yearly working time. Due to international variations in gross annual hours worked by employees in different hospitals, Net yearly working time per full time equivalent (FTE) should be calculated individually. Figure 10 shows an example with a gross working time of 40 hours per week.
Continuing the model calculation, based on a 42 hour week, with 19% ‘off-time’. Data from the human resources department at Jena University of Vienna showed that in 2015, there were 253 working days x 8.5 hours daily working time – 19%, equalling 1721 net working hours per year.
Total number of FTE needed for our model calculation
Using the basic formula in Figure 1 (number of staff needed = total workload per year (hr) divided by working time per staff (hr)), we arrive at the following calculation:
This concludes the first part of our calculation, which suggests a need for 18.6. FTEs. At this point it is essential that individual factors of an ED are taken into account, such as different consultant/resident ratios, time for research and teaching, and time for administrative tasks.
Adjusting the number of FTE to individual EDs
Adjusting to the ratio consultants/residents
The time spent per patient for physicians described in the literature9-14 refers to consultants/specialists. In most teaching hospitals, residents are part of the shift plan. Compared to consultants residents require longer to adequately see a patient by a factor of 1.3 as described in the literature.12 Residents not only need more time per patient, but also need supervising by a consultant, ultimately leaving the consultants with less time for their own direct patient consultations. Assuming 15 minutes supervision of educative time per resident and the factor 1.3 for resident’s longer time per patient, a sliding scale can be drawn to adjust the total number of FTEs to the desired or actual consultant/resident ratio (Figure 11). The more residents in the system, the more total FTE are required.
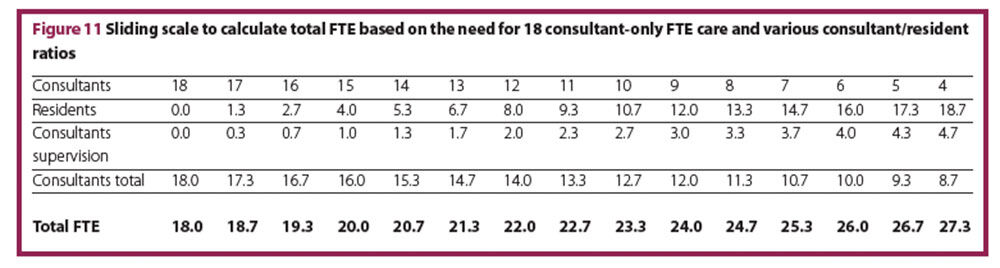
From an economic standpoint, a consultant/resident ratio of 50:50 is advisable.20 Applying this ratio to our model calculation, a total number of 24 FTE (12 consultants and 12 residents) is reasonable. If residents are not counted as FTE, then the number of FTE has to be adjusted only to the time for supervision. This sliding scale should demonstrate the change in total FTEs depending only on the consultants/residents ratio. Ideally one would make a shift plan for consultants and a shift plan for residents based on our assumptions, and then calculate the number of consultants and residents needed.
Adjusting for research and teaching
If research and teaching are part of the consultant’s duties, then this time has to be added to the total number of FTE. Teaching time can be easily calculated from the class schedule and times for preparation, whereas time for research is difficult to estimate. For our example calculation, 3.5 FTE are assumed for research and teaching.
Adjusting to administrative duties for consultants
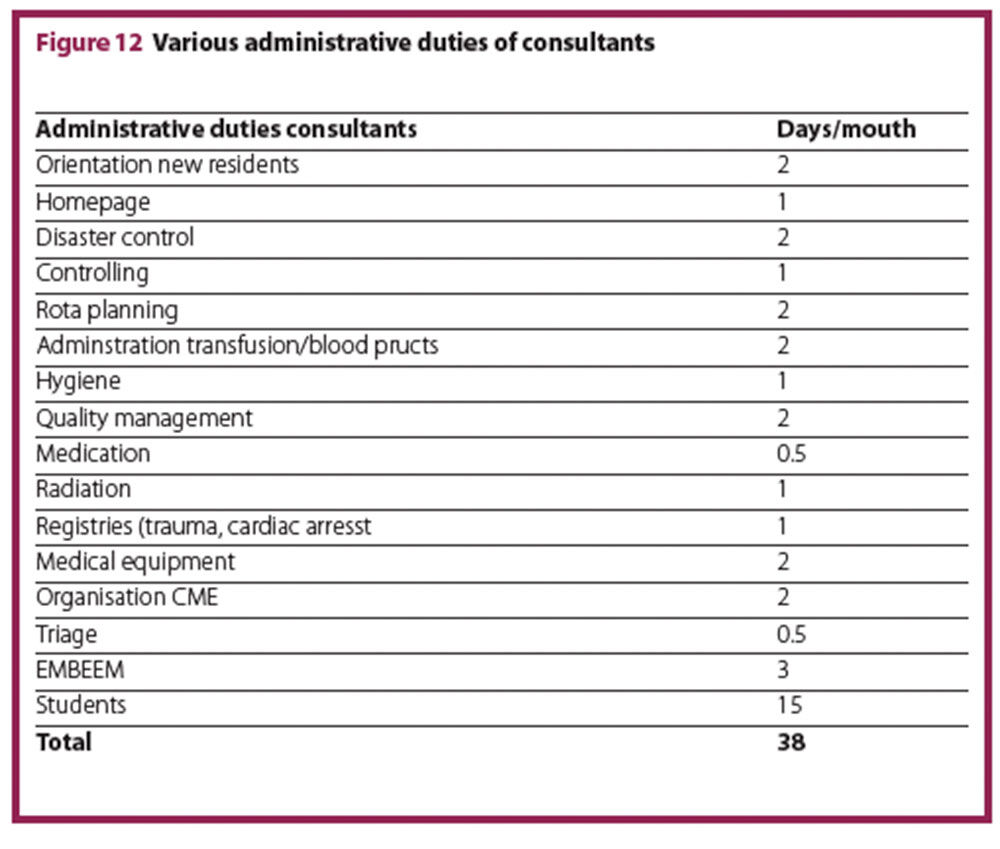
Consultants have multiple administrative duties, which have to be accounted for. Figure 12 lists possible duties and times, which were determined in an expert discussion among consultants (unpublished). The FTEs required for these duties depend on the yearly net working time. In the model calculation based on a 42-hour week with 19% off-time, the listed duties add an additional 2.2 FTEs.
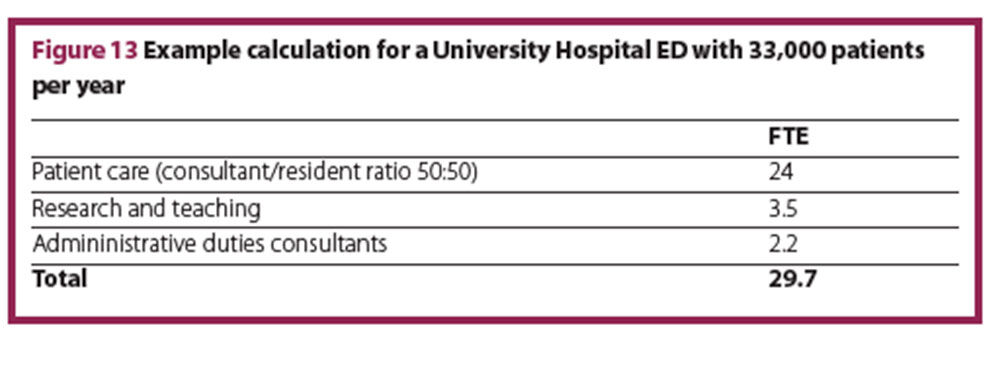
Total required FTEs
In the model calculation for a University Hospital ED with 33,000 patients per year, the total number of FTE physicians is a rounded 30 FTE (Figure 13).
Conclusions
ED staff calculations are complex. We propose a generic staff calculation model for physicians and nursing staff, based on objective data input, such as patients per hour and time committed to the patient for the individual triage acuity level. The model can be tailored to the unique needs of each individual ED. It might help to convince hospital management to provide sufficient resources for optimal staffing.
Authors
Jasmin Arrich MD MSc
Medical University of Vienna
Thorsten Raff MD MaHM
University of Jena, Faculty of Medicine, Germany
Christian Hohenstein MD
University of Jena, Faculty of Medicine, Germany
Wilhelm Behringer MD MBA MSc
University of Jena, Faculty of Medicine, Germany
References
1 Epstein SK et al. Emergency department crowding and risk of preventable medical errors. Intern emerg Med 2012;7:173–80.
2 Miro O et al. Decreased health care quality associated with emergency department overcrowding. Eur J Emerg Med 1999;6:105–7.
3 Richardson DB. Increase in patient mortality at 10 days associated with emergency department overcrowding. Med J Aust 2006;184:213–6.
4 Sprivulis PC et al. The association between hospital overcrowding and mortality among patients admitted via Western Australian emergency departments. Med J Aust 2006;184:208–12.
5 Jo S et al. Emergency department crowding is associated with 28-day mortality in community-acquired pneumonia patients. J Infect 2012;64:268–75.
6 Morris ZS et al. Emergency department crowding: towards an agenda for evidence-based intervention. Emerg Med J 2012;29:460–6.
7 Armony MW, Ward AR. Fair dynamic routing in large-scale heterogeneous-server systems. Operations Res 2010;58:624–37.
8 Song H et al. The diseconomies of queue pooling: An empirical investigation of emergency department length of stay. Manage Sci 2015;61:3032–53.
9 Anderson CK et al. Physician workload and the Canadian Emergency Department Triage and Acuity Scale: the Predictors of Workload in the Emergency Room (POWER) Study. CJEM 2009;11:321–9.
10 Graff LG, Radford MJ. Formula for emergency physician staffing. Am J Emerg Med. 1990;8:194–9.
11 Gries A et al. Personnel planning in the emergency department. Der Anaesthesist 2011;60:71-8.
12 Hogan B, Brachmann M. Personalbedarf in der Notaufnahme ist abhängig von der Facharztquote. Notfall Rettungsmed 2011;14:249–51.
13 Innes GD et al. Prospective time study derivation of emergency physician workload predictors. CJEM 2005;7:299–308.
14 Fullam C. Acuity-based ED nurse staffing: a successful 5-year experience. J Emerg Nurs 2002;28:138–40.
15 Australian Institute of Health and Welfare. Australian hospital statistics 2008–09. www.aihw.gov.au/publication-detail/?id=6442468373 (accessed March 2017).
16 Canadian Institute for Health Information. Highlights of 2011–2012 Emergency Department Visits and Inpatient Hospitalizations. 2013.
17 National Center for Health Statistics. National Hospital Ambulatory Medical Care Survey: 2010 Emergency Department Summary Tables. 2010.
18 Benneyan JC. An introduction to using computer simulation in healthcare: patient wait case study. J Soc Health Systems 1997;5:1–15.
19 Dall’Ora C et al. Characteristics of shift work and their impact on employee performance and wellbeing: A literature review. Int J Nurs Stud 2016;57:12–27.
20 Sucov A et al. A cost-efficiency analysis to increase clinician staffing in an academic emergency department. Acad Med 2009;84:1211–6.
